...
| Panel | ||||||
|---|---|---|---|---|---|---|
|
...
OpenTelemetry is an open-source project that standardizes the collection of telemetry data from software systems, making it easier for organizations to gain holistic visibility into their environments. By seamlessly integrating with various programming languages, frameworks, and cloud platforms, OpenTelemetry simplifies the instrumentation of applications, allowing developers and operators to collect rich, actionable data about their systems' behavior. The adoption of OpenTelemetry by software vendors and Application Performance Monitoring (APM) tools represents a significant shift in the observability landscape. OpenTelemetry has gained substantial traction across the industry due to its open-source, vendor-neutral approach and its ability to standardize telemetry data collection.
Many software vendors have started incorporating OpenTelemetry into their frameworks and libraries. Major cloud service providers like AWS, Azure, and Google Cloud have also embraced OpenTelemetry. In addition, many APM tools have integrated OpenTelemetry into their offerings. This integration allows users of these APM solutions to easily collect and visualize telemetry data from their applications instrumented with OpenTelemetry. It enhances the compatibility and flexibility of APM tools, making them more versatile in heterogeneous technology stacks.
Solution Architecture (Component Description)
...
- Linux Server
- Memory: 16GB RAM
- Storage: 70GB Net storage
- CPU: 4 CPU
- Distribution: Any major Linux distribution
- For the installation and configurations of the required Observability tools Administrative privileges are required
- Ports
The Following default ports will be used.
Application | Port |
|---|---|
| Prometheus | http: 9090 |
| Grafana: | http:3000 |
| Jaeger | http:16686 |
| Elastic | http:9200 |
| OTEL Collector | 4317 (grpc), 4318 (http) |
...
Note: This Startup Guide has been tested with the provide Software Version in the table below.
| Software | Version | Linux Archive |
|---|---|---|
| elasticsearch | 7.17.12 | https://artifacts.elastic.co/downloads/elasticsearch/elasticsearch-7.17.12-linux-x86_64.tar.gz |
otelcol-contrib | 0.86.0 | https://github.com/open-telemetry/opentelemetry-collector-releases/releases/download/v0.86.0/otelcol-contrib_0.86.0_linux_amd64.tar.gz |
jaeger all in one | 1.49.0 | https://github.com/jaegertracing/jaeger/releases/download/v1.49.0/jaeger-1.49.0-linux-amd64.tar.gz |
prometheus | 2.47.1 | https://github.com/prometheus/prometheus/releases/download/v2.47.1/prometheus-2.47.1.linux-amd64.tar.gz |
grafana-enterprise | 10.1.4 | https://dl.grafana.com/enterprise/release/grafana-enterprise-10.1.4.linux-amd64.tar.gz |
...
Elasticsearch is a distributed, RESTful search and analytics engine designed for real-time search and data storage. It is used for log and event data analysis, full-text search, and more.
In this set-up Elasticsearch is used as the storage backend for Jaeger.
Installation Steps:
Follow the official documentation to install Elasticsearch on your Linux Server.
...
Configuration File:
- elasticsearch.yml: Main configuration file for Elasticsearch, containing cluster, node, network, memory, and other settings.
No adjustments to the default elasticsearch.yml file are required.
| Code Block | ||||
|---|---|---|---|---|
| ||||
# ======================== Elasticsearch Configuration ========================= # # NOTE: Elasticsearch comes with reasonable defaults for most settings. # Before you set out to tweak and tune the configuration, make sure you # understand what are you trying to accomplish and the consequences. # # The primary way of configuring a node is via this file. This template lists # the most important settings you may want to configure for a production cluster. # # Please consult the documentation for further information on configuration options: # https://www.elastic.co/guide/en/elasticsearch/reference/index.html # # ---------------------------------- Cluster ----------------------------------- # # Use a descriptive name for your cluster: # #cluster.name: my-application # # ------------------------------------ Node ------------------------------------ # # Use a descriptive name for the node: # #node.name: node-1 # # Add custom attributes to the node: # #node.attr.rack: r1 # # ----------------------------------- Paths ------------------------------------ # # Path to directory where to store the data (separate multiple locations by comma): # #path.data: /path/to/data # # Path to log files: # #path.logs: /path/to/logs # # ----------------------------------- Memory ----------------------------------- # # Lock the memory on startup: # #bootstrap.memory_lock: true # # Make sure that the heap size is set to about half the memory available # on the system and that the owner of the process is allowed to use this # limit. # # Elasticsearch performs poorly when the system is swapping the memory. # # ---------------------------------- Network ----------------------------------- # # By default Elasticsearch is only accessible on localhost. Set a different # address here to expose this node on the network: # #network.host: 192.168.0.1 # # By default Elasticsearch listens for HTTP traffic on the first free port it # finds starting at 9200. Set a specific HTTP port here: # #http.port: 9200 # # For more information, consult the network module documentation. # # --------------------------------- Discovery ---------------------------------- # # Pass an initial list of hosts to perform discovery when this node is started: # The default list of hosts is ["127.0.0.1", "[::1]"] # #discovery.seed_hosts: ["host1", "host2"] # # Bootstrap the cluster using an initial set of master-eligible nodes: # #cluster.initial_master_nodes: ["node-1", "node-2"] # # For more information, consult the discovery and cluster formation module documentation. # # ---------------------------------- Various ----------------------------------- # # Require explicit names when deleting indices: # #action.destructive_requires_name: true # # ---------------------------------- Security ---------------------------------- # # *** WARNING *** # # Elasticsearch security features are not enabled by default. # These features are free, but require configuration changes to enable them. # This means that users don’t have to provide credentials and can get full access # to the cluster. Network connections are also not encrypted. # # To protect your data, we strongly encourage you to enable the Elasticsearch security features. # Refer to the following documentation for instructions. # # https://www.elastic.co/guide/en/elasticsearch/reference/7.16/configuring-stack-security.html |
...
Setup up Jaeger
Description:
Jaeger is an open-source distributed tracing system used for monitoring and troubleshooting microservices-based applications.
In this set-up Universal Controller will manually instrument Open Telemetry trace on Universal Controller (UC), OMS, Universal Agent (UA), and Universal Task Extension interactions associated with task instance executions, agent registration, and Universal Task of type Extension deployment.
...
Install the Version listed in chapter Required Software for the Observability.
For a quick local installation the Jaeger all-in-one executable can be used. It includes the Jaeger UI, jaeger-collector, jaeger-query, and jaeger-agent, with an in memory storage component.
Configuration:
When starting the jaeger-all-in-one application the following command-line argument need to be set:
--collector.otlp.grpc.host-port :14317: This is a command-line argument passed to the Jaeger all-in-one binary to configure the host and port for the gRPC OTLP ( OpenTelemetry Protocol) endpoint. It specifies that the gRPC OTLP endpoint should listen on port 14317.--collector.otlp.http.host-port :14318: This is another command-line argument that configures the host and port for the HTTP OTLP endpoint, specifying port 14318.
...
Setup OTEL Collector
Description:
OpenTelemetry Collector is a vendor-agnostic observability data collector that gathers traces, metrics, and other telemetry data from various sources and sends it to different backends for analysis.
In this set-up OpenTelemetry collects Metrics data from Universal Controller, Universal Agent, OMS and Universal Tasks of type Extension.
Installation Steps:
Follow the official documentation to install OpenTelemetry on your Linux Server.
Official Documentation: OpenTelemetry Collector Installation
...
- otel-collector-config.yaml, Primary configuration file, which specifies how the collector should receive, process, and export telemetry data.
Let's break down the key sections and settings in this configuration
- Receiver: For UAC the HTTP, GRPC receiver for the OpenTelemetry Collector needs to be configured. The HTTP port (4318) or GRPC port (4317) should match the ports configured in the 'omss.conf' and 'uags.conf' files.
- Exporters: The following Exporters are configured to send telemetry data to: logging, Prometheus, and Jaeger
- Pipelines: Two pipelines are configured:
- traces: otlp → batch → jaeger
- metrics: otlp → batch → prometheus
The following provides a sample otel-collector-config.yaml file.
Note: In the omss.conf and uags.conf file the port needs to be set to 4318. refer to Configuring OTLP Endpoint to configure the omss.conf and uags.conf port for OpenTelemetry.
| Code Block | ||||
|---|---|---|---|---|
| ||||
# otel-collector-config.yaml
# the http port 4318 (default) or grpc port 4317 should be the same as in the omss.conf and uags.conf
receivers:
  otlp:
    protocols:
      http:
        #tls:
        #cert_file: ue-cert.crt
        #key_file: ue-cert.key
        #endpoint: 0.0.0.0:4318
      grpc:
        #endpoint: 0.0.0.0:4317
exporters:
  logging:
    verbosity: detailed
  prometheus:
    endpoint: 0.0.0.0:8881
      #tls:
      #ca_file: "/path/to/ca.pem"
      #cert_file: "/path/to/cert.pem"
      #key_file: "/path/to/key.pem"
      #namespace: UAgent
      #const_labels:
      #label1: value1
      #"another label": spaced value
      #send_timestamps: true
      #metric_expiration: 180m
      #enable_open_metrics: true
      #add_metric_suffixes: false
    resource_to_telemetry_conversion:
      enabled: true
  jaeger:
    endpoint: localhost:14250
    tls:
      insecure: true
processors:
  batch:
service:
  pipelines:
    traces:
      receivers: [otlp]
      processors: [batch]
      exporters: [jaeger]
    metrics:
      receivers: [otlp]
      processors: [batch]
      exporters: [prometheus]
|
...
Set up Prometheus
Description:
Prometheus is an open-source monitoring and alerting toolkit designed for reliability and scalability. It collects metrics from monitored targets, stores them, and provides powerful querying and alerting capabilities.
In this set-up Prometheus is used to store the Metrics data retrieved via Opentelemetry and the Universal Controller Metrics REST API.
Installation Steps:
Follow the official documentation to install Prometheus on your Linux Server.
Official Documentation: Prometheus Installation Guide
...
Configuration Files:
- prometheus.yml: Main configuration file for Prometheus, defining scrape targets (what to monitor), alerting rules, and other settings.
In the prometheus.yaml configuration file for UAC the following scrape jobs are defined what metrics to collect and from where.
- OTelCollector' job, Prometheus collects metrics from the target
127.0.0.1:8881, which corresponds to the OpenTelemetry Collector's OTLP endpoint. - prometheus job, with the the
/metricsendpoint provides internal metrics related to the Prometheus server's performance and resource utilization. - controller job, Prometheus collects data via the Universal Controller Webservice Metrics API. Replace
'ops.admin'and'xxx'with the actual username and password required to access the metrics.
| Code Block | ||||
|---|---|---|---|---|
| ||||
# my global config
global:
  scrape_interval: 15s # Set the scrape interval to every 15 seconds. Default is every 1 minute.
  evaluation_interval: 15s # Evaluate rules every 15 seconds. The default is every 1 minute.
  # scrape_timeout is set to the global default (10s).

# Alertmanager configuration
alerting:
  alertmanagers:
    - static_configs:
        - targets:
          # - alertmanager:9093

# Load rules once and periodically evaluate them according to the global 'evaluation_interval'.
rule_files:
  # - "first_rules.yml"
  # - "second_rules.yml"

# A scrape configuration containing exactly one endpoint to scrape:
# Here it's Prometheus itself.
scrape_configs:
  # The job name is added as a label `job=<job_name>` to any timeseries scraped from this config.

    # metrics_path defaults to '/metrics'
    # scheme defaults to 'http'.

  - job_name: 'OTelCollector'
    static_configs:
      - targets: ["127.0.0.1:8881"]
        #- job_name: "OTelCollector"
        #static_configs:
        #- targets: ["127.0.0.1:8888"]

  - job_name: 'prometheus'
    metrics_path: /metrics
    static_configs:
    - targets:
      - localhost:9090

  - job_name: 'controller'
    basic_auth:
       username: 'ops.admin'
       password: 'canton123'
    metrics_path: '/uc/resources/metrics'  # The correct path where the metrics are exposed by the web service. Note for cloud controller: '/resources/metrics'
    static_configs:
      - targets:
              - 'localhost:8080'  # Use the correct hostname or IP address and port of your web service.
|
...
| Code Block | ||
|---|---|---|
| ||
# Check default Port: ss -tuln | grep 9090 # Result: tcp LISTEN 0 128 *:9090 *:* |
Test that the prometheus GUI is accessibly: http://<hostname>:9090
...
Set up Grafana
Description:
Grafana is an open-source platform for monitoring and observability that allows you to create, explore, and share dynamic dashboards and visualizations for various data sources, including time series databases.
In the this set-up Grafana is used to Visualize and Analyze the Metrics data store in Prometheus data source (time series database).
Installation Steps:
Follow the official documentation to install Grafana on your Linux Server.
Install the Version listed in chapter Required Software for the Observability.
...
Official Documentation: Links to OMS and UAG open telemetry configuration options.
| Anchor | ||||
|---|---|---|---|---|
|
Beginner's Guide to Universal Automation Center Observability
Tutorial 1: Metrics Data Collection and Analysis using Grafana
This The first tutorial will explain how to collect Metrics Data from the differed different UAC components and display the collected data in a Grafana Dashboard using Prometheus as the Datasource.
The second tutorial will be explain how to collect Trace Data from the differed UAC components and display the collected data in a Grafana Dashboard using Jaeger as Datasource.
Metrics data can be collected from Universal Controller, Universal Agent, OMS and Universal Tasks of type Extension.
...
To enable Open Telemetry metrics, an Open Telemetry (OTEL) collector with a Prometheus exporter will be configured in this tutorial.

Installation
Prerequisites
...
- Linux Server
- Memory: 16GB RAM
- Storage: 70GB Net storage
- CPU: 4 CPU
- Distribution: Any major Linux distribution
- For the installation and configurations of the required Observability tools, Administrative privileges are required
- Ports
The Following default ports will be used.
Application | Port |
|---|---|
| Prometheus | http:9090 |
| Grafana | http:3000 |
| OTEL Collector | 4317 (grpc), 4318 (http) |
...
This Tutorial has been tested with the provided Software Versions in the table below.
| Software | Version | Linux Archive |
|---|---|---|
otelcol-contrib | 0.82.0 | https://github.com/open-telemetry/opentelemetry-collector-releases/releases/download/v0.82.0/otelcol-contrib_0.82.0_linux_amd64.tar.gz |
prometheus | 2.47.1 | https://github.com/prometheus/prometheus/releases/download/v2.47.1/prometheus-2.47.1.linux-amd64.tar.gz |
grafana-enterprise | 10.1.4 | https://dl.grafana.com/enterprise/release/grafana-enterprise-10.1.4.linux-amd64.tar.gz |
...
- Install Prometheus
- Install OpenTelemetry Collector
- Install Grafana
- Configure Universal Agents to send metrics to open-telemetryOpenTelemetry
- Update Universal Controller (uc.properties) to send metrics to open-telemetryOpenTelemetry
- Configure a sample Dashboard in grafana Grafana (add prometheus Prometheus datasource, create visualization)
- Optionally configure grafana Grafana for TLS
| Highlight | |
|---|---|
| |
| Note | |
| |
The required applications Prometheus, OpenTelemetry Collector and Grafana will be installed to for this tutorial in the home directory of a Linux user with sudo permissions. Replace the sample Server IP (192.168.88.17) and Name (wiesloch) with your Server IP and Hostname. |
...
Download prometheus to your home directory and unpack it
| Code Block | ||||||||
|---|---|---|---|---|---|---|---|---|
| ||||||||
cd ~
curl -LJO https://github.com/prometheus/prometheus/releases/download/v2.47.1/prometheus-2.47.1.linux-amd64.tar.gz
tar -xvzf prometheus-2.47.1.linux-amd64.tar.gz --directory ~ |
Create Softlink
| Code Block | ||||||||
|---|---|---|---|---|---|---|---|---|
| ||||||||
ln -sf prometheus-2.47.1.linux-amd64 prometheus |
Adjust config file: prometheus.yml
| Code Block | ||||||||||
|---|---|---|---|---|---|---|---|---|---|---|
| ||||||||||
# Adjustments: # Adjust the Controller username and password # Adjust the Controller targets and metrics_path # Local Controller: # - metrics_path: '/uc/resources/metrics' # - target: 'wiesloch:8080' # Cloud Controller: # - metrics_path: '/resources/metrics' # - target: 'uc.companya.cloud' # vi ~/prometheus/prometheus.yml # my global config global: scrape_interval: 15s # Set the scrape interval to every 15 seconds. Default is every 1 minute. evaluation_interval: 15s # Evaluate rules every 15 seconds. The default is every 1 minute. # scrape_timeout is set to the global default (10s). # Alertmanager configuration alerting: alertmanagers: - static_configs: - targets: # - alertmanager:9093 # Load rules once and periodically evaluate them according to the global 'evaluation_interval'. rule_files: # - "first_rules.yml" # - "second_rules.yml" # A scrape configuration containing exactly one endpoint to scrape: # Here it's Prometheus itself. scrape_configs: # The job name is added as a label `job=<job_name>` to any timeseries scraped from this config. # metrics_path defaults to '/metrics' # scheme defaults to 'http'. - job_name: 'OTelCollector' static_configs: - targets: ["127.0.0.1:8881"] #- job_name: "OTelCollector" #static_configs: #- targets: ["127.0.0.1:8888"] - job_name: 'prometheus' metrics_path: /metrics static_configs: - targets: - localhost:9090 - - job_name: 'controller' basic_auth: username: 'ops.admin'observ' password: 'xxxxobserv' metrics_path: '/uc/resources/metrics' # Thefor correctcloud pathcontroller where the metrics are exposed by the web service. without /uc/: /resources/metrics static_configs: - targets: - 'wiesloch:8080' # Use the correct hostname or IP address and port of your web service. |
Create Start Script
| Code Block | ||||||||||
|---|---|---|---|---|---|---|---|---|---|---|
| ||||||||||
# vi ~/start_prometheus.sh

#! /bin/bash

timestamp=$(date +%Y%m%d%H%M%S)
cd ~/prometheus
nohup ./prometheus --config.file=prometheus.yml --log.level=debug 0</dev/null >prometheus_$timestamp.out 2>prometheus_$timestamp.err &
sleep 3
echo "Started $(pidof prometheus)" |
Create Stop Script
| Code Block | ||||||||
|---|---|---|---|---|---|---|---|---|
| ||||||||
# vi ~/stop_prometheus.sh

#! /bin/bash

pid=$(pidof prometheus)
if [ -n "$pid" ]; then
    kill $pid
    echo "Stopped $pid"
else
    echo "No pid found"
fi
|
Start/Stop Prometheus
| Code Block | ||||||||
|---|---|---|---|---|---|---|---|---|
| ||||||||
cd ~ ./chmod +x start_prometheus.sh chmod +x stop_prometheus.sh ./start_prometheus.sh ./stop_prometheus.sh |
Checks
| Code Block | ||||||||
|---|---|---|---|---|---|---|---|---|
| ||||||||
Log Files: ~/prometheus/prometheus_<YYYYMMDDHHMMSS>.err ~/prometheus/prometheus_<YYYYMMDDHHMMSS>.out URL: http://wiesloch:9090 Port: sudoss netstat -tuln | grep 9090 => tcp LISTEN 0 128 *:9090 *:* Process: ps aux | grep prometheus |
2. Install OpenTelemetry Collector
opentelemetry-collector will be configured to export metrics to Prometheus
Download opentelemetry-collector to your home directory and unpack it
| Code Block |
|---|
cd ~ curl -LJO https://github. => stonebr+ 38093 0.1 0.4 1316792 76608 pts/0 Sl 16:33 0:00 ./prometheus --config.file=prometheus.yml --log.level=debug |
2. Install OpenTelemetry Collector
opentelemetry-collector will be configured to export metrics to Prometheus
Download opentelemetry-collector to your home directory and unpack it
| Code Block | ||||||||
|---|---|---|---|---|---|---|---|---|
| ||||||||
cd ~
curl -LJO https://github.com/open-telemetry/opentelemetry-collector-releases/releases/download/v0.82.0/otelcol-contrib_0.82.0_linux_amd64.tar.gz
mkdir ~/otelcol
tar -xvzf otelcol-contrib_0.82.0_linux_amd64.tar.gz --directory ~/otelcol |
Adjust config file: otel-collector-config.yaml
| Code Block | ||||||||
|---|---|---|---|---|---|---|---|---|
| ||||||||
# verify that the http port 4318 (default) is the same then in the omss.conf and uags.conf

# vi ~/otelcol/otel-collector-config.yaml

receivers:
  otlp:
    protocols:
      http:
        #tls:
        #cert_file: ue-cert.crt
        #key_file: ue-cert.key
        #endpoint: 0.0.0.0:4318
      grpc:
        #endpoint: 0.0.0.0:4317
exporters:
  logging:
    verbosity: detailed
  prometheus:
    endpoint: 0.0.0.0:8881
      #tls:
      #ca_file: "/path/to/ca.pem"
      #cert_file: "/path/to/cert.pem"
      #key_file: "/path/to/key.pem"
      #namespace: UAgent
      #const_labels:
      #label1: value1
      #"another label": spaced value
      #send_timestamps: true
      #metric_expiration: 180m
      #enable_open_metrics: true
      #add_metric_suffixes: false
    resource_to_telemetry_conversion:
      enabled: true
processors:
  batch:
service:
  pipelines:
    metrics:
      receivers: [otlp]
      processors: [batch]
exporters: [prometheus] |
Create Start Script
| Code Block | ||||||||
|---|---|---|---|---|---|---|---|---|
| ||||||||
# vi ~/start_otelcol.sh

#! /bin/bash

timestamp=$(date +%Y%m%d%H%M%S)
cd ~/otelcol
nohup ./otelcol-contrib --config=otel-collector-config.yaml 0</dev/null >otelcol_$timestamp.out 2>otelcol_$timestamp.err &
sleep 3
echo "Started $(pidof otelcol-contrib)" |
Create Stop Script
| Code Block | ||||||||
|---|---|---|---|---|---|---|---|---|
| ||||||||
vi ~/stop_otelcol.sh

#! /bin/bash

pid=$(pidof otelcol-contrib)
if [ -n "$pid" ]; then
    kill $pid
    echo "Stopped $pid"
else
    echo "No pid found"
fi |
Start/Stop
| Code Block | ||||||||
|---|---|---|---|---|---|---|---|---|
| ||||||||
cd ~ chmod +x start_otelcol.sh chmod +x stop_otelcol.sh ./start_otelcol.sh ./stop_otelcol.sh |
Checks
| Code Block | ||||||||
|---|---|---|---|---|---|---|---|---|
| ||||||||
Log Files: ~/otelcol/otelcol_<YYYYMMDDHHMMSS>.err ~/otelcol/otelcol_<YYYYMMDDHHMMSS>.out |
3. Install Grafana
Download Grafana to your home directory and unpack it
| Code Block |
|---|
cd ~ curl -O https://dl.grafana.com/enterprise/release/grafana-enterprise-10.1.4.linux-amd64.tar.gz chmod -R 755 Process: ps aux | grep otelcol-contrib => stonebr+ 38898 0.2 0.7 913032 129860 pts/0 Sl 16:41 0:00 ./otelcol-contrib --config=otel-collector-config.yaml |
3. Install Grafana
Download Grafana to your home directory and unpack it
| Code Block | ||||||||
|---|---|---|---|---|---|---|---|---|
| ||||||||
cd ~ curl -O https://dl.grafana.com/enterprise/release/grafana-enterprise-10.1.4.linux-amd64.tar.gz tar -xvzf grafana-enterprise-10.1.4.linux-amd64.tar.gz --directory ~ |
Create Softlink
| Code Block | ||||||||
|---|---|---|---|---|---|---|---|---|
| ||||||||
ln -sf grafana-10.1.4 ~/grafana |
Create Start Script
| Code Block | ||||||||
|---|---|---|---|---|---|---|---|---|
| ||||||||
# vi ~/start_grafana.sh

#! /bin/bash

timestamp=$(date +%Y%m%d%H%M%S)
cd ~/grafana
nohup bin/grafana server 0</dev/null >grafana_$timestamp.out 2>grafana_$timestamp.err &
sleep 3
echo "Started $(pidof grafana)" |
Create Stop Script
| Code Block | ||||||||
|---|---|---|---|---|---|---|---|---|
| ||||||||
# vi ~/stop_grafana.sh

#! /bin/bash

pid=$(pidof grafana)
if [ -n "$pid" ]; then
    kill $pid
    echo "Stopped $pid"
else
    echo "No pid found"
fi |
Start/Stop Grafana
| Code Block | ||||||||
|---|---|---|---|---|---|---|---|---|
| ||||||||
cd ~ chmod +x start_grafana.sh chmod +x stop_grafana.sh ./stop_grafana.sh ./start_garfana.sh |
Checks
| Code Block | ||||||||
|---|---|---|---|---|---|---|---|---|
| ||||||||
Log Files: ~/ grafana/grafana_<YYYYMMDDHHMMSS>.err ~/ grafana/grafana_<YYYYMMDDHHMMSS>.out URL: http://192.168.88.17:3000/ user:admin pass:admin |
4. Configure Universal Agents to send metrics to open-telemetry
Configure uags.conf and omss.conf of the Universal Agent
| Code Block | ||||||||
|---|---|---|---|---|---|---|---|---|
| ||||||||
# Add the following to uags.conf # Adjust the sample IP "192.168.88.17" Address to your IP or hostname vi /etc/universal/uags.conf otel_export_metrics YES otel_service_name agt_wiesloch_uag otel_metrics_endpoint http://192.168.88.17:4318 # Add the following to omss.conf vi /etc/universal/omss.conf otel_export_metrics YES otel_service_name agt_wiesloch_oms otel_metrics_endpoint http://192.168.88.17:4318 # Note: Agents push metrics via http ( not grpc ) port 4318 |
5. Update Universal Controller (uc.properties) to send metrics to open-telemetry
Update uc.properties file
| Code Block |
|---|
# enable metrics for UC Controller in |
Start/Stop
| Code Block | ||||||||
|---|---|---|---|---|---|---|---|---|
| ||||||||
# restart/Stop Universal Agent
sudo /opt/unversal/ubroker/ubrokerd restart
sudo /opt/unversal/ubroker/ubrokerd stop |
Checks
| Code Block | ||||||||
|---|---|---|---|---|---|---|---|---|
| ||||||||
Log Files:
# UAG
sudo vi /var/opt/universal/uag/logs/agent.log
# Broker
sudo vi /var/opt/universal/log/unv.log |
5. Update Universal Controller (uc.properties) to send metrics to open-telemetry
Update uc.properties file
| Code Block | ||||||||
|---|---|---|---|---|---|---|---|---|
| ||||||||
# enable metrics for UC Controller in uc.properties file # Adjust the vi command to point to your uc.properties file # sudo vi /homeusr/stonebranchshare/apache-tomcat-9.0.3980/conf/uc.properties # Metrics uses http protocol: uc.otel.exporter.otlp.metrics.endpoint http://localhost:4317 |
6. Configure a sample Dashboard in Grafana (add prometheus datasource, create visualization)
In the following example, a Grafana Dashboard with one visualization showing the OMS Server Status will be configured.
The following Steps need to be performed:
- Log-in to Grafana
- Add prometheus as data source for Grafana
- Create a new Dashboard and add a new visualization to it
- Configure visualization
- Display Dashboard
Log-in to Grafana
URL: http://192.168.88.17:3000/ user:admin pass:admin

Add prometheus as data source for Grafana
Datasource: Prometheus - http://192.168.88.17:9090/ ( adjust the sample IP to your Server IP Address or Hostname )

Test the connection:

Create a new Dashboard and add a new visualization to it

Configure Visualization
- Select Prometheus as Data Source
- Select the Metric uc_oms_server_status
- Enter a Title and Description e.g. OMS Server Status
- In the Legend Options enter {{instance}}

Display Dashboard

7. Optionally configure grafana for TLS
TLS for Grafana
...
Official Documentation: link to uc.properties open telemetry properties.
Start/ Stop Tomcat
| Code Block | ||||||||
|---|---|---|---|---|---|---|---|---|
| ||||||||
# stop/start Tomcat ( adjust according to your environment )
sudo /usr/share/apache-tomcat-9.0.80/bin/shutdown.sh
sudo /usr/share/apache-tomcat-9.0.80/bin/startup.sh

Optionally
sudo /etc/init.d/uac_tomcat stop
sudo /etc/init.d/uac_tomcat start |
Checks
| Code Block | ||||||||
|---|---|---|---|---|---|---|---|---|
| ||||||||
Log Files:
# Adjust to the location of your Tomcat directory
sudo cat /usr/share/apache-tomcat-9.0.80/uc_logs/uc.log
|
6. Configure a sample Dashboard in Grafana (add prometheus datasource, create visualization)
In the following example, a Grafana Dashboard with one visualization showing the OMS Server Status will be configured.
The following Steps need to be performed:
- Log-in to Grafana
- Add prometheus as data source for Grafana
- Create a new Dashboard and add a new visualization to it
- Configure visualization
- Display Dashboard
Log-in to Grafana
URL: http://192.168.88.17:3000/ user:admin pass:admin
Add prometheus as data source for Grafana
Datasource: Prometheus - http://192.168.88.17:9090 ( adjust the sample IP to your Server IP Address or Hostname )
Test the connection:
Create a new Dashboard and add a new visualization to it
Configure Visualization
- Select Prometheus as Data Source
- Select the Metric uc_oms_server_status
- Enter a Title and Description e.g. OMS Server Status
- In the Legend Options enter {{instance}}
Display Dashboard
7. Optionally configure grafana for TLS
TLS for Grafana
| Code Block | ||||||||
|---|---|---|---|---|---|---|---|---|
| ||||||||
# Creating a Self-signed Certificate for Grafana TLS connection

documentation link:
https://grafana.com/docs/grafana/latest/setup-grafana/set-up-https/

cd ~/grafana
# generate private key
sudo openssl genrsa -out ~/grafana/grafana.key 2048

# generate certificate using the private key
sudo openssl req -new -key ~/grafana/grafana.key -out ~/grafana/grafana.csr

# check
ls -ltr ~/grafana
-rw-------  1 root        root   1679 Nov 10 09:24 grafana.key
-rw-r--r--  1 root        root   1070 Nov 10 09:28 grafana.csr

# create self-sign the certificate with the private key, for a period of validity of 720 days:
sudo openssl x509 -req -days 720 -in ~/grafana/grafana.csr -signkey ~/grafana/grafana.key -out ~/grafana/grafana.crt

# set the appropriate permissions for the files
sudo chown stonebranch ~/grafana/grafana.crt
sudo chown stonebranch ~/grafana/grafana.key
sudo chmod 400 ~/grafana/grafana.key ~/grafana/grafana.crt

# adjust grafana ini file defaults.ini
vi ~/grafana/conf/defaults.ini

[server]
protocol = https
http_port = 3000
domain = wiesloch
cert_file = /home/stonebranch/grafana/grafana.crt
cert_key = /home/stonebranch/grafana/grafana.key

# re-start grafana.
~/start_grafana.sh


# Check URL accessible via HTTPS
URL:
https://192.168.88.17:3000/
Login: admin/admin

# Using Self-signed Certificates in Firefox

Type: about:preferences#privacy and go to: Privacy & Security -> View Certificates
(go to Settings -> Privacy & Security -> View Certificates)
choose Servers Tab and click Add Exception
fill in the https URL: https://192.168.88.17:3000 and click Get Certificate
click Confirm Security Exception
|
Tutorial 2: Traces Data Collection and Analysis using Grafana and Jaeger
This tutorial will show how to collect and visualize traces from the different UAC components in Grafana and Jaeger.
This tutorial requires that all configuration steps from the first tutorial have already been performed.
After finishing this Tutorial, you will be able to collect and display Metrics and Traces in Grafana and show Jaeger Traces embedded in the Universal Controller UI.
Universal Controller will manually instrument Open Telemetry trace on Universal Controller (UC), OMS, Universal Agent (UA), and Universal Task Extension interactions associated with task instance executions, agent registration, and Universal Task of type Extension deployment.
To enable tracing, an Open Telemetry span exporter must be configured.
The collected Trace data is stored in Elasticsearch for analysis in Jaeger and Grafana.
The following outlines the architecture:
.png?version=1&modificationDate=1705676968497&cacheVersion=1&api=v2&height=400)
Installation
Prerequisites
This tutorial requires that all configuration steps from the first tutorial have been already performed.
Server Requirements
the same Linux Server as in the first part of the Tutorial will be used.
The following additional ports need to be opened:
Application | Port |
|---|---|
| Elastic Search | http:9200 |
| Jaeger | http:16686 |
Pre-Installed Software Components
This tutorial requires the following software, installed during the first Tutorial.
Software | Version | Linux Archive |
|---|---|---|
Universal Controller | 7.5.0.0 or higher | Download via Stonebranch Support Portal |
Universal Agent | 7.5.0.0 or higher | Download via Stonebranch Support Portal |
otelcol-contrib | 0.82.0 | https://github.com/open-telemetry/opentelemetry-collector-releases/releases/download/v0.82.0/otelcol-contrib_0.82.0_linux_amd64.tar.gz |
prometheus | 2.47.1 | https://github.com/prometheus/prometheus/releases/download/v2.47.1/prometheus-2.47.1.linux-amd64.tar.gz |
grafana-enterprise | 10.1.4 | https://dl.grafana.com/enterprise/release/grafana-enterprise-10.1.4.linux-amd64.tar.gz |
Required Software for Observability - Traces
To add support for traces, the following Opensource Software needs to be installed.
Software | Version | Linux Archive |
|---|---|---|
| elasticsearch | 7.17.12 | https://artifacts.elastic.co/downloads/elasticsearch/elasticsearch-7.17.12-linux-x86_64.tar.gz |
| jaeger | 1.47.0 | https://github.com/jaegertracing/jaeger/releases/download/v1.47.0/jaeger-1.47.0-linux-amd64.tar.gz |
Installation Steps
- Install Elasticsearch
- Install Jaeger
- Add a pipeline for traces in OpenTelemetry Collector
- Enable Tracing in Universal controller
- Enable Tracing in Universal Agents
- Start/Stop Script for all Applications
- Configure a sample Dashboard for traces in grafana ( add jaeger as datasource, create visualization, view trace)
| Highlight | ||
|---|---|---|
| ||
The required applications Elasticsearch, Prometheus, OpenTelemetry Collector, Jaeger and Grafana will be installed for this tutorial in the home directory of a Linux user with sudo permissions. Replace the sample Server IP (192.168.88.17) and Name (wiesloch) with your Server IP and Hostname. |
1. Install Elasticsearch
Download Elasticsearch to your home directory and unpack it
| Code Block | ||||||||
|---|---|---|---|---|---|---|---|---|
| ||||||||
cd ~
curl -O https://artifacts.elastic.co/downloads/elasticsearch/elasticsearch-7.17.12-linux-x86_64.tar.gz
tar -xvzf elasticsearch-7.17.12-linux-x86_64.tar.gz --directory ~
# Create Softlink
ln -sf elasticsearch-7.17.12 ~/elasticsearch |
Adjust jvm options in jvm_heap_size.options
| Code Block | ||||||
|---|---|---|---|---|---|---|
| ||||||
# vi ~/elasticsearch/config/jvm.options.d/jvm_heap_size.options

-Xms1g
-Xmx1g |
Create Start Script
| Code Block | ||||||||
|---|---|---|---|---|---|---|---|---|
| ||||||||
# vi ~/start_elasticsearch.sh

#!/bin/bash

# Set the correct path to your Java JDK
export ES_JAVA_HOME=/home/stonebranch/elasticsearch/jdk

# Set the correct path to your Elasticsearch installation
export ES_HOME=/home/stonebranch/elasticsearch

cd "$ES_HOME"

# Start Elasticsearch in daemon mode, write PID to file
./bin/elasticsearch -d -p pid

# Sleep for a short duration to allow Elasticsearch to start (adjust as needed)
sleep 10

# Display a message with the process ID
echo " Started $(cat pid)" |
Create Stop Script
| Code Block | ||||||||
|---|---|---|---|---|---|---|---|---|
| ||||||||
# vi ~/stop_elasticsearch.sh

#!/bin/bash

# Change the directory to the Elasticsearch installation directory
cd ~/elasticsearch

# Check if the 'pid' file exists
if [ -f pid ]; then
    # Read the process ID from the 'pid' file
    pid=$(cat pid)

    # Check if the process with the specified ID exists
    if ps -p $pid > /dev/null; then
        # If the process exists, stop it
        kill -SIGTERM $pid
        echo "Stopping Elasticsearch (PID: $pid)"

        # Wait for the process to stop (poll every 1 second)
        while ps -p $pid > /dev/null; do
            echo "Waiting for Elasticsearch to stop..."
            sleep 5
        done

        echo "Elasticsearch has been successfully stopped."

    else
        echo " Stopped (PID $pid not found)"
    fi

    # Remove the 'pid' file only if it exists
    if [ -f pid ]; then
        rm pid
    fi

else
    echo "No pid found"
fi |
Start/Stop
| Code Block | ||||||||
|---|---|---|---|---|---|---|---|---|
| ||||||||
cd ~
chmod +x start_elasticsearch.sh
chmod +x stop_elasticsearch.sh

./start_elasticsearch.sh
./stop_elasticsearch.sh |
Checks
| Code Block | ||||||||
|---|---|---|---|---|---|---|---|---|
| ||||||||
Web:
curl -XGET "http://127.0.0.1:9200"
curl -X GET "http://127.0.0.1:9200/_cat/indices?v"
curl -X GET "http://127.0.0.1:9200/_cluster/health"

Log Files:
cat ~/elasticsearch/logs/elasticsearch.log
cat ~/elasticsearch/logs/gc.log

Check default Port:
ss -tuln | grep 9200

# Result:
tcp    LISTEN  0       128      [::ffff:127.0.0.1]:9200                 *:*

Config file:
cat ~/elasticsearch/elasticsearch.yml |
2. Install Jaeger
Download jaeger to your home directory and unpack it
| Code Block | ||||||||
|---|---|---|---|---|---|---|---|---|
| ||||||||
cd ~
curl -LJO https://github.com/jaegertracing/jaeger/releases/download/v1.47.0/jaeger-1.47.0-linux-amd64.tar.gz
tar -xvzf jaeger-1.47.0-linux-amd64.tar.gz --directory ~
# create Softlink
ln -sf jaeger-1.47.0-linux-amd64 ~/jaeger |
Add new config file: jaeger-config.yaml
| Code Block | ||||||||
|---|---|---|---|---|---|---|---|---|
| ||||||||
# vi ~/jaeger/jaeger-config.yaml

collector:
  otlp:
    grpc:
      host-port: "14317"
    http:
      host-port: "14318"
http_server:
base_path: /jaeger |
Create Start Script
| Code Block | ||||||||
|---|---|---|---|---|---|---|---|---|
| ||||||||
# vi ~/start_jaeger.sh

#! /bin/bash
timestamp=$(date +%Y%m%d%H%M%S)
#export JAEGER_SERVICE_NAME=jenkins-tst_traces
export SPAN_STORAGE_TYPE="elasticsearch"
cd ~/jaeger
nohup ./jaeger-all-in-one --config-file /home/stonebranch/jaeger/jaeger-config.yaml 0</dev/null >jaeger-all-in-one_$timestamp.out 2>jaeger-all-in-one_$timestamp.err &
sleep 3
echo "Started $(pidof jaeger-all-in-one)" |
Create Stop Script
| Code Block | ||||||||
|---|---|---|---|---|---|---|---|---|
| ||||||||
# vi ~/stop_jaeger.sh

#! /bin/bash
pid=$(pidof jaeger-all-in-one)
if [ -n "$pid" ]; then
    kill $pid
    echo "Stopped $pid"
else
    echo "No pid found"
fi
|
Start/Stop
| Code Block | ||||||||
|---|---|---|---|---|---|---|---|---|
| ||||||||
cd ~
./start_jaeger.sh
./stop_jaeger.sh |
Checks
| Code Block | ||||||||
|---|---|---|---|---|---|---|---|---|
| ||||||||
Log Files:
~/jaeger/jaeger-all-in-one_<YYYYMMDDHHMMSS>.err
~/jaeger/jaeger-all-in-one_<YYYYMMDDHHMMSS>.out

Port:
sudo ss -tulpn | grep 4317
=> tcp    LISTEN  0       128                       *:14317                *:*      users:(("jaeger-all-in-o",pid=10251,fd=11))

URL:
http://wiesloch:16686/
|
3. Add a pipeline for traces in OpenTelemetry Collector
Adjust otel-collector-config.yaml
| Code Block | ||||||||
|---|---|---|---|---|---|---|---|---|
| ||||||||
# vi ~/otelcol/otel-collector-config.yaml

# Add Jaeger in exporters section
# Add Jaeger for traces

receivers:
  otlp:
    protocols:
      http:
        #tls:
        #cert_file: ue-cert.crt
        #key_file: ue-cert.key
        #endpoint: 0.0.0.0:4318
      grpc:
        #endpoint: 0.0.0.0:4317
exporters:
  logging:
    verbosity: detailed
  prometheus:
    endpoint: 0.0.0.0:8881
      #tls:
      #ca_file: "/path/to/ca.pem"
      #cert_file: "/path/to/cert.pem"
      #key_file: "/path/to/key.pem"
      #namespace: UAgent
      #const_labels:
      #label1: value1
      #"another label": spaced value
      #send_timestamps: true
      #metric_expiration: 180m
      #enable_open_metrics: true
      #add_metric_suffixes: false
    resource_to_telemetry_conversion:
      enabled: true
  jaeger:
    endpoint: localhost:14250
    tls:
      insecure: true
processors:
  batch:
service:
  pipelines:
    traces:
      receivers: [otlp]
      processors: [batch]
      exporters: [jaeger]
    metrics:
      receivers: [otlp]
      processors: [batch]
exporters: [prometheus] |
Create Start Script
The same start Script as in the first part of the Tutorial should be used.
Create Stop Script
The same stop Script as in the first part of the Tutorial should be used.
Start/Stop
| Code Block | ||||||||
|---|---|---|---|---|---|---|---|---|
| ||||||||
cd ~
chmod +x ./start_otelcol.sh
chmod +x ./stop_otelcol.sh

./start_otelcol.sh
./stop_otelcol.sh |
Checks
| Code Block | ||||||||
|---|---|---|---|---|---|---|---|---|
| ||||||||
Log Files:
~/otelcol/otelcol_<YYYYMMDDHHMMSS>.err
~/otelcol/otelcol_<YYYYMMDDHHMMSS>.out |
4. Enable Tracing in Universal controller
Update uc.properties
| Code Block | ||||||||
|---|---|---|---|---|---|---|---|---|
| ||||||||
# stop tomcat ( adjust according to your environment )
sudo /usr/share/apache-tomcat-9.0.80/bin/shutdown.sh

# enable traces (grpc protocol) for Universal Controller
sudo vi /usr/share/apache-tomcat-9.0.80/conf/uc.properties
uc.otel.exporter.otlp.traces.endpoint http://localhost:4317

# start tomcat ( adjust according to your environment )
sudo /usr/share/apache-tomcat-9.0.80/bin/startup.sh
|
Official Documentation: link to uc.properties open telemetry properties.
Start/ Stop Tomcat
| Code Block | ||||||||
|---|---|---|---|---|---|---|---|---|
| ||||||||
# stop/start Tomcat ( adjust according to your environment )
sudo /usr/share/apache-tomcat-9.0.80/bin/shutdown.sh
sudo /usr/share/apache-tomcat-9.0.80/bin/startup.sh

Optionally:
sudo /etc/init.d/uac_tomcat stop
sudo /etc/init.d/uac_tomcat start |
Checks
| Code Block | ||||||||
|---|---|---|---|---|---|---|---|---|
| ||||||||
Log Files:
# Adjust to the location of your Tomcat directory
sudo cat /usr/share/apache-tomcat-9.0.80/uc_logs/uc.log
|
Update Universal Controller
Enable Open Telemetry Visualization in IFrame and add the Open Telemetry Visualization URL to Point to Jaeger or optionally to Grafana
Jaeger to visualize Traces
UC Controller Properties:
- open telemetry visualization URL for Jaeger: http://wiesloch:16686/trace/${traceId}?uiFind=${spanId}&uiEmbed=v0
- open telemetry visualization Iframe : True

Optionally use Grafana to visualize Traces
To embed the Grafana dashboard in Universal Controller, you need to enable in the grafana.ini file "allow_embedding = true", as well as changing "cookie_samesite = disabled" to allow users to log in and to stay logged in the grafana page
Grafana default.ini
| Code Block | ||||||||
|---|---|---|---|---|---|---|---|---|
| ||||||||
vi ~/grafana/conf/default.ini

#################################### Security ############################
[security]
...
# set to true if you want to allow browsers to render Grafana in a <frame>, <iframe>, <embed> or <object>. default is false.

allow_embedding = true
...
# set cookie SameSite attribute. defaults to `lax`. can be set to "lax", "strict", "none" and "disabled"
cookie_samesite = disabled
... |
UC Controller Properties:
- open telemetry visualization URL for Grafana: https://192.168.88.17:3000/explore?left={"datasource":"yourjaegeruid","queries":[{"refId":"A","query":"${traceId}"}]}
- open telemetry visualization Iframe : True
Note: the yourjaegeruid can be looked up in the URL Grafana for the Jaeger Datasource (see Screenshot below).

5. Enable Tracing in Universal Agents
Configure uags.conf and omss.conf of the Universal Agent
| Code Block | ||||||||
|---|---|---|---|---|---|---|---|---|
| ||||||||
# Add the following to:
# uags.conf and omss.conf

sudo vi /etc/universal/uags.conf
sudo vi /etc/universal/omss.conf

otel_enable_tracing YES
otel_trace_endpoint http://192.168.88.17:4318

# Restart the Agent
sudo /opt/universal/ubroker/ubrokerd restart |
Start/Stop
| Code Block | ||||||||
|---|---|---|---|---|---|---|---|---|
| ||||||||
# Start/Stop Universal Agent
sudo /opt/unversal/ubroker/ubrokerd start
sudo /opt/unversal/ubroker/ubrokerd stop |
Checks
| Code Block | ||||||||
|---|---|---|---|---|---|---|---|---|
| ||||||||
Log Files:
# UAG
sudo vi /var/opt/universal/uag/logs/agent.log
# Broker
sudo vi /var/opt/universal/log/unv.log |
6. Start/Stop Script for all Applications
It is important to start the applications in the correct order, because the Software components have dependencies between each other.
Example:
- Jaeger needs Elasticsearch to store the trace data.
- OTEL Collector needs Prometheus to store the metrics data.
- Grafana needs Prometheus as data source for displaying metrics data in the dashboard
- Grafana needs Jaeger as data source for displaying traces in the dashboard
The following provides the correct order to start/stop all application
Startup All
| Code Block | ||||||||
|---|---|---|---|---|---|---|---|---|
| ||||||||
cd ~
./start_elasticsearch.sh
./start_jaeger.sh
./start_prometheus.sh
./start_otelcol.sh
./start_grafana.sh |
Stop All
| Code Block | ||||||||
|---|---|---|---|---|---|---|---|---|
| ||||||||
cd ~
./stop_grafana.sh
./stop_otelcol.sh
./stop_prometheus.sh
./stop_jaeger.sh
./stop_elasticsearch.sh |
Startup Script to start all Applications
| Code Block | ||||||||
|---|---|---|---|---|---|---|---|---|
| ||||||||
vi  ~/start_apm.sh

#! /bin/bash

if [ $# -eq 0 ]; then
	module_list='elasticsearch jaeger prometheus otelcol grafana'
else
	module_list=$@
fi

i=0
for module in $module_list
do
	i=$((i + 1))
	echo -n "Starting - $i: $module ... "
	./start_$module.sh
	#PID=$!
	#wait $PID
	#echo " ok (PID: $PID)"
done |
Stop Script to stop all Applications
| Code Block | ||||||||
|---|---|---|---|---|---|---|---|---|
| ||||||||
vi ~/stop_apm.sh

#! /bin/bash

if [ $# -eq 0 ]; then
	module_list='grafana otelcol prometheus jaeger elasticsearch'
else
	module_list=$@
fi

i=0
for module in $module_list
do
	i=$((i + 1))
	echo -n "Stopping - $i: $module ... "
	./stop_$module.sh
	#PID=$!
	#wait $PID
	#echo " ok (PID: $PID)"
done
|
Start/Stop All Applications
| Code Block | ||||||||
|---|---|---|---|---|---|---|---|---|
| ||||||||
start/stop all applications:
./start_apm.sh
./stop_apm.sh |
7. Configure a sample tracing dashboard in Grafana (add jaeger data source, create visualization, view trace)
In this example, a Grafana dashboard with one tracing visualization showing incoming traces from the controller will be configured
The following steps need to be performed:
- Log-in to Grafana
- Add Jaeger as a data source for Grafana
- Create or access a dashboard and add a visualization
- Configure the visualization with the jaeger data source set
- Click on a trace to open detailed information about the trace
Log-in to Grafana
URL: http(s)://192.168.88.17:3000/
The default username and password is: user: admin password: admin
Add jaeger as a data source for Grafana
Go to the data sources tab and choosing jaeger as a data source
The default server url for jaeger is: http://192.168.88.17:16686/

At the bottom test the connection and save the data source if it connected succesfully

Head to the dashboards tab and create/access a dashboard and add a visualization to the dashboard
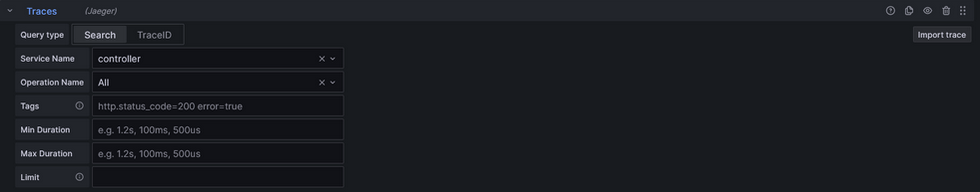
Configure the visualization: (Examples)
- Select the jaeger data source
- Select the "search" tab for a general view of traces or the "traceid" tab for a specific trace
- Choose the controller as the service name and choose "all" operation names
- Add the "sort by" transformation set to start time
- Select that all tooltips should be shown
- Save the visualization

Click on a given trace and open the link in a new tab

The trace will now be shown in a detailed view

Traces can also be viewed using the "show trace" option in the controller:
Go to the properties page and set "Open Telemetry Visulization In IFrame" to "true"
Set the value for the "Open Telemetry Visualization URL" to the Grafana URL: "http(s)://192.168.88.17:3000/explore?left={"datasource":"yourjaegeruid","queries":[{"refId":"A","query":"${traceId}"}]}"

Head over to a task and right-click on it. Choose the "show trace" under the "details" tab

A new browser tab will open with the given task trace inside of the Grafana explore section
Example Widgets inside of Grafana
Grafana has no sharing options for Dashboards or Widgets. Copying the JSON model of one of the widgets will result in a "datasource not found" error. This can be solved by choosing the same metric in the metric picker and clicking the "run query" button.
Widgets for System data (Agents, OMS)
Number of Agents connected

Description:
This Widget shows the number of Agents connected and has an indicator for the upper limit of how many Agents can connect to the controller.
The upper limit depends on the number of licenses the controller owns.
This Widget uses the “Time series” configuration to give a real time update on the Agent status.
Configuration:
The Widget is constructed using 2 metrics derived from the controller:
The first query is the “uc_license_agents_distributed_max” metric which will show the maximum amount of licenses available, which is used to show the upper limit graph.
The second query is the “uc_license_agents_distributed_used” metric which shows the amount of Agents currently connected to the controller.
Seen below is an example of the configuration used to make it an opaque graph that runs through the time series.

Below are the 2 PromQL lines used to configure the queries
| Code Block |
|---|
uc_license_agents_distributed_max
|
| Code Block |
|---|
uc_license_agents_distributed_used
|
| Code Block | ||||||
|---|---|---|---|---|---|---|
| ||||||
{
  "datasource": {
    "type": "prometheus",
    "uid": "a65085b5-82cf-490b-a6cb-c01306f4a949"
  },
  "description": "This Widget shows the number of Agents connected and has an indicator for the upper limit of how many Agents can connect to the controller. The upper limit depends on the number of licenses the controller owns.",
  "fieldConfig": {
    "defaults": {
      "custom": {
        "drawStyle": "line",
        "lineInterpolation": "linear",
        "barAlignment": 0,
        "lineWidth": 1,
        "fillOpacity": 58,
        "gradientMode": "none",
        "spanNulls": true,
        "insertNulls": false,
        "showPoints": "never",
        "pointSize": 5,
        "stacking": {
          "mode": "none",
          "group": "A"
        },
        "axisPlacement": "auto",
        "axisLabel": "",
        "axisColorMode": "series",
        "scaleDistribution": {
          "type": "linear"
        },
        "axisCenteredZero": false,
        "hideFrom": {
          "tooltip": false,
          "viz": false,
          "legend": false
        },
        "thresholdsStyle": {
          "mode": "off"
        },
        "axisGridShow": false,
        "axisSoftMin": 0,
        "lineStyle": {
          "fill": "solid"
        }
      },
      "color": {
        "mode": "palette-classic"
      },
      "mappings": [],
      "thresholds": {
        "mode": "absolute",
        "steps": [
          {
            "color": "green",
            "value": null
          },
          {
            "color": "red",
            "value": 80
          }
        ]
      },
      "decimals": 0
    },
    "overrides": [
      {
        "matcher": {
          "id": "byFrameRefID",
          "options": "Maximum Agents"
        },
        "properties": [
          {
            "id": "displayName",
            "value": "Max Number of Agents"
          },
          {
            "id": "color",
            "value": {
              "fixedColor": "dark-red",
              "mode": "fixed",
              "seriesBy": "max"
            }
          },
          {
            "id": "custom.fillOpacity",
            "value": 0
          }
        ]
      },
      {
        "matcher": {
          "id": "byFrameRefID",
          "options": "#Agents connected"
        },
        "properties": [
          {
            "id": "displayName",
            "value": "Total Number of used Agents"
          },
          {
            "id": "color",
            "value": {
              "fixedColor": "green",
              "mode": "shades"
            }
          }
        ]
      }
    ]
  },
  "gridPos": {
    "h": 8,
    "w": 6,
    "x": 18,
    "y": 29
  },
  "id": 11,
  "options": {
    "tooltip": {
      "mode": "single",
      "sort": "none"
    },
    "legend": {
      "showLegend": true,
      "displayMode": "list",
      "placement": "bottom",
      "calcs": []
    }
  },
  "pluginVersion": "10.1.4",
  "targets": [
    {
      "datasource": {
        "type": "prometheus",
        "uid": "a65085b5-82cf-490b-a6cb-c01306f4a949"
      },
      "disableTextWrap": false,
      "editorMode": "builder",
      "expr": "uc_license_agents_distributed_max",
      "fullMetaSearch": false,
      "includeNullMetadata": true,
      "instant": false,
      "legendFormat": "__auto",
      "range": true,
      "refId": "Maximum Agents",
      "useBackend": false
    },
    {
      "datasource": {
        "type": "prometheus",
        "uid": "a65085b5-82cf-490b-a6cb-c01306f4a949"
      },
      "disableTextWrap": false,
      "editorMode": "builder",
      "expr": "uc_license_agents_distributed_used",
      "fullMetaSearch": false,
      "hide": false,
      "includeNullMetadata": true,
      "instant": false,
      "legendFormat": "__auto",
      "range": true,
      "refId": "#Agents connected",
      "useBackend": false
    }
  ],
  "title": "#Agents connected",
  "type": "timeseries"
} |
OMS Server Status

Description:
OMS Server Status shown in a "Status History" graph. Depending on the number of OMS server connected the graph changes to represent them.
The graph will also show the different states an OMS server can be.
Configuration:
This query is made from the “uc_oms_server_status” metric using the code
| Code Block |
|---|
sum by(instance) (uc_oms_server_status) |
The metric can send 3 different types of values depending on the OMS status. 1 for “running”, 0 for “not running”, -1 for “in doubt”.
To ensure the Widget shows this information we change add value mappings for the different states the server can be.

| Code Block | ||||||
|---|---|---|---|---|---|---|
| ||||||
{
  "datasource": {
    "type": "prometheus",
    "uid": "a65085b5-82cf-490b-a6cb-c01306f4a949"
  },
  "description": "OMS Server Status shown in a \"Status History\" graph. Depending on the number of OMS server connected the graph changes to represent them. Every addition of an OMS server needs a new query for overriding the name.",
  "fieldConfig": {
    "defaults": {
      "mappings": [
        {
          "options": {
            "0": {
              "color": "red",
              "index": 0,
              "text": "Offline"
            },
            "1": {
              "color": "green",
              "index": 1,
              "text": "Online"
            },
            "-1": {
              "color": "yellow",
              "index": 2,
              "text": "In doubt"
            }
          },
          "type": "value"
        }
      ],
      "thresholds": {
        "mode": "absolute",
        "steps": [
          {
            "color": "green",
            "value": null
          }
        ]
      },
      "unit": "short"
    },
    "overrides": []
  },
  "gridPos": {
    "h": 8,
    "w": 6,
    "x": 0,
    "y": 29
  },
  "id": 1,
  "options": {
    "reduceOptions": {
      "values": false,
      "calcs": [
        "lastNotNull"
      ],
      "fields": ""
    },
    "orientation": "auto",
    "textMode": "auto",
    "colorMode": "background",
    "graphMode": "none",
    "justifyMode": "auto"
  },
  "pluginVersion": "10.1.4",
  "targets": [
    {
      "datasource": {
        "type": "prometheus",
        "uid": "a65085b5-82cf-490b-a6cb-c01306f4a949"
      },
      "disableTextWrap": false,
      "editorMode": "builder",
      "expr": "sum by(instance) (uc_oms_server_status)",
      "fullMetaSearch": false,
      "includeNullMetadata": true,
      "instant": false,
      "legendFormat": "__auto",
      "range": true,
      "refId": "OMS Server Status",
      "useBackend": false
    }
  ],
  "title": "OMS Server Status",
  "type": "stat"
} |
Active OMS Server Client connections
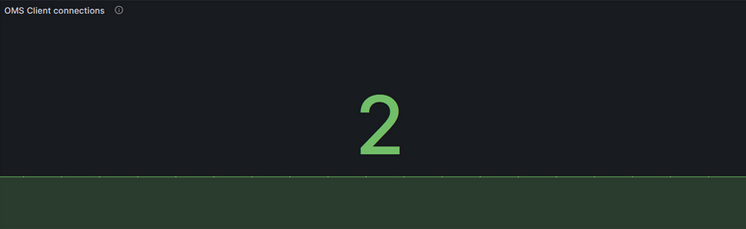
Description:
Widget that shows how many Clients are connecting to an OMS server. It will count the connections from agents and controller that connect to the OMS server.
Configuration:
This query uses the “ua_active_connections” metric to read out the number of active connections to all OMS server and showing them using the “Stats” graph.
To set up the Widget, select the metric using the metrics browser or paste the following line in the code builder of Grafana:
| Code Block |
|---|
sum by(instance) (ua_active_connections) |
As more OMS servers are sending metrics to the OTelCollector, the stats graph will update to represent them.
Furthermore on the settings on the right side under the “Value mappings” tab we add a note that says "0 → No active connections"

| Code Block | ||||||
|---|---|---|---|---|---|---|
| ||||||
{
  "datasource": {
    "type": "prometheus",
    "uid": "a65085b5-82cf-490b-a6cb-c01306f4a949"
  },
  "description": "Widget that shows how many Clients are connecting to an OMS server. It will count the connections from agents and controller that connect to the OMS server",
  "fieldConfig": {
    "defaults": {
      "mappings": [
        {
          "options": {
            "0": {
              "color": "light-red",
              "index": 0,
              "text": "No active connections"
            }
          },
          "type": "value"
        }
      ],
      "thresholds": {
        "mode": "absolute",
        "steps": [
          {
            "color": "green",
            "value": null
          }
        ]
      },
      "color": {
        "mode": "thresholds"
      }
    },
    "overrides": []
  },
  "gridPos": {
    "h": 8,
    "w": 6,
    "x": 12,
    "y": 37
  },
  "id": 4,
  "options": {
    "reduceOptions": {
      "values": false,
      "calcs": [
        "lastNotNull"
      ],
      "fields": ""
    },
    "orientation": "auto",
    "textMode": "auto",
    "colorMode": "value",
    "graphMode": "area",
    "justifyMode": "auto"
  },
  "pluginVersion": "10.1.4",
  "targets": [
    {
      "datasource": {
        "type": "prometheus",
        "uid": "a65085b5-82cf-490b-a6cb-c01306f4a949"
      },
      "disableTextWrap": false,
      "editorMode": "builder",
      "expr": "sum by(instance) (ua_active_connections)",
      "fullMetaSearch": false,
      "hide": false,
      "includeNullMetadata": false,
      "instant": false,
      "legendFormat": "__auto",
      "range": true,
      "refId": "A",
      "useBackend": false
    }
  ],
  "title": "OMS Client connections",
  "type": "stat"
} |
Widgets for observing Tasks and Task statuse
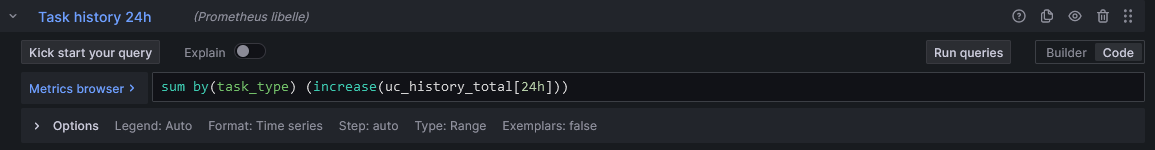
Tasks started in a set time period

Description:
This “Stat” graph is showing how many tasks have been created in a time period that can be specified. This example shows the Tasks from a 24h time period.
Configuration:
To create this Widget, we use the “uc_history_total” metric to receive all the data from tasks of the universal controller and universal agent.
When creating the query, use the metric browser to find the “uc_history_total” metric and choose the operations “Increase” from the “Range functions” tab and the “Sum” from the Aggregations tab.
Label the “Increase” range to the specified time period you wish to observe (in the example, 24h) and set the “Sum by” label to “task_type”.
The code builder should now look like this:
| Code Block |
|---|
sum by(task_type) (increase(uc_history_total[24h])) |
| Code Block | ||||||
|---|---|---|---|---|---|---|
| ||||||
{
  "gridPos": {
    "h": 8,
    "w": 6,
    "x": 18,
    "y": 20
  },
  "id": 20,
  "title": "Tasks started in the last 24h",
  "targets": [
    {
      "datasource": {
        "type": "prometheus",
        "uid": "a65085b5-82cf-490b-a6cb-c01306f4a949"
      },
      "disableTextWrap": false,
      "editorMode": "builder",
      "expr": "sum by(task_type) (increase(uc_history_total[24h]))",
      "fullMetaSearch": false,
      "hide": false,
      "includeNullMetadata": true,
      "instant": false,
      "legendFormat": "__auto",
      "range": true,
      "refId": "Task history 24h",
      "useBackend": false
    }
  ],
  "options": {
    "reduceOptions": {
      "values": false,
      "calcs": [
        "lastNotNull"
      ],
      "fields": ""
    },
    "orientation": "auto",
    "textMode": "value_and_name",
    "colorMode": "background",
    "graphMode": "area",
    "justifyMode": "center",
    "text": {
      "titleSize": 16,
      "valueSize": 16
    }
  },
  "fieldConfig": {
    "defaults": {
      "mappings": [
        {
          "options": {
            "0": {
              "color": "text",
              "index": 0,
              "text": "No Tasks yet"
            }
          },
          "type": "value"
        }
      ],
      "thresholds": {
        "mode": "absolute",
        "steps": [
          {
            "color": "green",
            "value": null
          }
        ]
      },
      "decimals": 0,
      "unit": "short"
    },
    "overrides": []
  },
  "datasource": {
    "type": "prometheus",
    "uid": "a65085b5-82cf-490b-a6cb-c01306f4a949"
  },
  "description": "How many tasks started in the last 24h\n",
  "pluginVersion": "10.1.4",
  "type": "stat"
} |
Task duration split of tasks launched in a time period
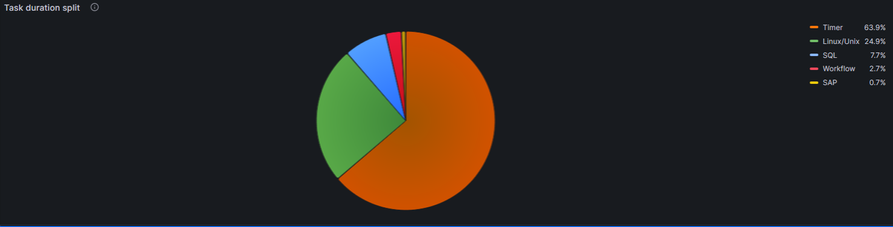
Description:
This “Stat” graph is showing how many tasks have been created in a time period that can be specified. This example shows the Tasks from a 24h time period.
Configuration:
To create this Widget, we use the “uc_history_total” metric to receive all the data from tasks of the universal controller and universal agent.
When creating the query, use the metric browser to find the “uc_history_total” metric and choose the operations “Increase” from the “Range functions” tab and the “Sum” from the Aggregations tab.
Label the “Increase” range to the specified time period you wish to observe (in the example 24h) and set the “Sum by” label to “task_type”.
The code builder should now look like this:
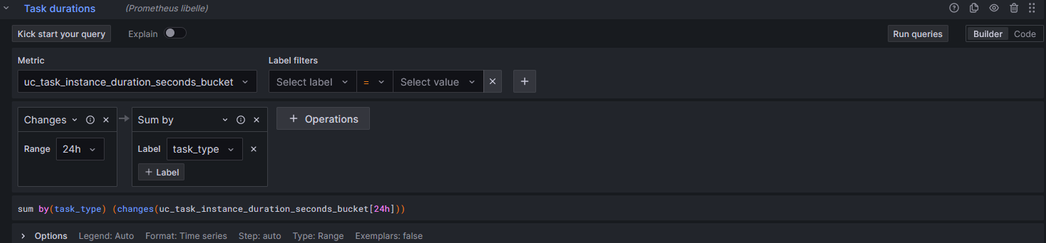
You can also add this line of code directly into the code tab to receive the settings:
| Code Block |
|---|
sum by(task_type) (changes(uc_task_instance_duration_seconds_bucket[24h])) |
It is important that in the standard options tab of the general settings the unit is set to “duration (s)” and the decimal point is set to at least 1 decimal point for more accuracy.
| Code Block | ||||||
|---|---|---|---|---|---|---|
| ||||||
{
  "datasource": {
    "type": "prometheus",
    "uid": "a65085b5-82cf-490b-a6cb-c01306f4a949"
  },
  "description": "Shows the duration of tasks in the last given time period.",
  "fieldConfig": {
    "defaults": {
      "custom": {
        "hideFrom": {
          "tooltip": false,
          "viz": false,
          "legend": false
        }
      },
      "color": {
        "mode": "palette-classic"
      },
      "mappings": [],
      "decimals": 1,
      "unit": "dtdurations"
    },
    "overrides": []
  },
  "gridPos": {
    "h": 8,
    "w": 6,
    "x": 12,
    "y": 12
  },
  "id": 23,
  "options": {
    "reduceOptions": {
      "values": false,
      "calcs": [
        "lastNotNull"
      ],
      "fields": ""
    },
    "pieType": "pie",
    "tooltip": {
      "mode": "single",
      "sort": "none"
    },
    "legend": {
      "showLegend": true,
      "displayMode": "list",
      "placement": "right",
      "values": [
        "percent"
      ]
    }
  },
  "pluginVersion": "10.1.4",
  "targets": [
    {
      "datasource": {
        "type": "prometheus",
        "uid": "a65085b5-82cf-490b-a6cb-c01306f4a949"
      },
      "disableTextWrap": false,
      "editorMode": "builder",
      "expr": "sum by(task_type) (changes(uc_task_instance_duration_seconds_bucket[24h]))",
      "fullMetaSearch": false,
      "includeNullMetadata": true,
      "instant": false,
      "legendFormat": "__auto",
      "range": true,
      "refId": "Task durations",
      "useBackend": false
    }
  ],
  "title": "Task duration split",
  "type": "piechart"
} |
Successful/Late Finish ratio shown in a Pie chart of a given Task type

Description:
Pie chart which shows the percentage of "Late Tasks" in reference to the total amount of tasks (Last 1h in this example; Linux Tasks in this example).
Configuration:
This pie chart is made up of 2 queries that will represent the ratio of “Late Finish” Tasks and “successful” Tasks.
The first query is made from using the “uc_task_instance_late_finish_total” metric and using a label filter on the specified Task we want to observe.
Using the Operator “Delta” gives the query a time period to observe the metric data. (In this example it is 1h).
The “Sum by” is set to “task_type” to ensure all metric data of the specified task is displayed.
Using an “Override” we name the query for the pie chart and set a color.
The second query is made up of the “uc_history_total” and the “uc_task_instance_late_finish_total” metric and subtracting them the “Late Finish” tasks from the total.
Similar to the first query we specify a time period using the “Delta” operator and the “Sum by” operator, as well as set the label filter to the tasks we observe.
Using a “Binary operations with query” operator allows for the second metric to be set as the “uc_task_instance_late_finish_total” metric and set to the same as the first query.
Using the “-” in the operation will result in all tasks being shown once and not be counted a second time for the pie chart.
Using the “Override” we set a color and optionally a name for the pie chart.
The code for the queries is below:

first query
| Code Block |
|---|
sum by(task_type) (delta(uc_task_instance_late_finish_total[1h])) |
second query
| Code Block |
|---|
sum by(task_type) (delta(uc_history_total[1h])) - sum by(task_type) (delta(uc_task_instance_late_finish_total[1h])) |
| Code Block | ||||||
|---|---|---|---|---|---|---|
| ||||||
{
  "datasource": {
    "type": "prometheus",
    "uid": "a65085b5-82cf-490b-a6cb-c01306f4a949"
  },
  "description": "Pie chart which shows the percentage of \"Late Tasks\" in reference to the total amount of tasks (Last 1h in this example; Linux Tasks in this example)",
  "fieldConfig": {
    "defaults": {
      "custom": {
        "hideFrom": {
          "tooltip": false,
          "viz": false,
          "legend": false
        }
      },
      "color": {
        "mode": "palette-classic"
      },
      "mappings": [
        {
          "options": {
            "0": {
              "index": 0,
              "text": "None"
            }
          },
          "type": "value"
        }
      ],
      "decimals": 0,
      "noValue": "-"
    },
    "overrides": [
      {
        "matcher": {
          "id": "byFrameRefID",
          "options": "Late_Finished_Tasks"
        },
        "properties": [
          {
            "id": "color",
            "value": {
              "fixedColor": "yellow",
              "mode": "fixed"
            }
          },
          {
            "id": "displayName",
            "value": "Late Finish Tasks"
          }
        ]
      },
      {
        "matcher": {
          "id": "byFrameRefID",
          "options": "Total_Linux_Tasks"
        },
        "properties": [
          {
            "id": "color",
            "value": {
              "fixedColor": "green",
              "mode": "fixed"
            }
          }
        ]
      }
    ]
  },
  "gridPos": {
    "h": 8,
    "w": 6,
    "x": 12,
    "y": 20
  },
  "id": 22,
  "options": {
    "reduceOptions": {
      "values": false,
      "calcs": [
        "lastNotNull"
      ],
      "fields": ""
    },
    "pieType": "pie",
    "tooltip": {
      "mode": "single",
      "sort": "none"
    },
    "legend": {
      "showLegend": true,
      "displayMode": "list",
      "placement": "right",
      "values": [
        "percent"
      ]
    },
    "displayLabels": [
      "percent",
      "name"
    ]
  },
  "pluginVersion": "10.1.4",
  "targets": [
    {
      "datasource": {
        "type": "prometheus",
        "uid": "a65085b5-82cf-490b-a6cb-c01306f4a949"
      },
      "disableTextWrap": false,
      "editorMode": "builder",
      "expr": "sum by(task_type) (delta(uc_task_instance_late_finish_total[1h]))",
      "fullMetaSearch": false,
      "includeNullMetadata": true,
      "instant": false,
      "legendFormat": "__auto",
      "range": true,
      "refId": "Late_Finished_Tasks",
      "useBackend": false
    },
    {
      "datasource": {
        "type": "prometheus",
        "uid": "a65085b5-82cf-490b-a6cb-c01306f4a949"
      },
      "disableTextWrap": false,
      "editorMode": "builder",
      "expr": "sum by(task_type) (delta(uc_history_total[1h])) - sum by(task_type) (delta(uc_task_instance_late_finish_total[1h]))",
      "fullMetaSearch": false,
      "hide": false,
      "includeNullMetadata": true,
      "instant": false,
      "legendFormat": "__auto",
      "range": true,
      "refId": "Total_Linux_Tasks",
      "useBackend": false
    }
  ],
  "title": "Task Instance Late Finish",
  "type": "piechart"
} |
Widgets for Traces
Bar Chart of incoming traces

Description:
This Widget displays all the traces coming from the universal controller and displaying their duration. Hovering over a trace will give more information about the trace.
Configuration:
The bar chart is taking the “Jaeger” data source and accessing all the traces that come from the universal controller. The query is configured as follows:
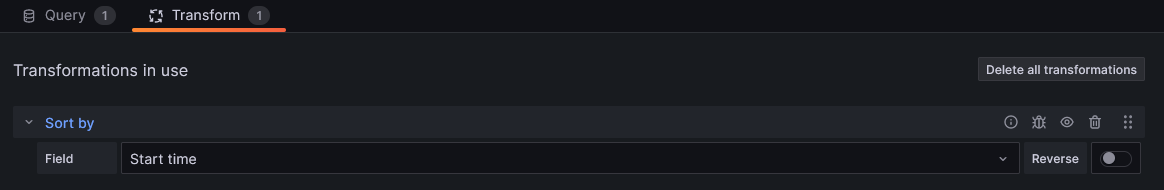
Once the query is set up. We need to add a transformation for the graph. Doing to the "transform" tab and choosing "sort by" and sorting by the start time will result in the trace links matching the correct traces.
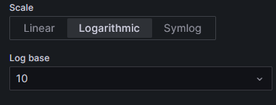
Going to the general settings tab and changing the X-Axis to the start time and setting the Y-axis to a log10 scale will allow for more visibility.
Changing the Tooltip to show all information allows the user to hover over a trace and inspect it more closely using grafana’s trace tools.

Clicking on the trace link will result in a new tab opening up for detailed views of the trace:

| Code Block | ||||||
|---|---|---|---|---|---|---|
| ||||||
{
  "datasource": {
    "type": "jaeger",
    "uid": "ba9176e4-0b3b-437c-ab29-045d734b5b63"
  },
  "description": "This Widget displays all the traces coming from the controller and agent and displaying their duration. Hovering over a trace will give more information about the trace.",
  "fieldConfig": {
    "defaults": {
      "custom": {
        "lineWidth": 1,
        "fillOpacity": 80,
        "gradientMode": "hue",
        "axisPlacement": "left",
        "axisLabel": "",
        "axisColorMode": "series",
        "scaleDistribution": {
          "type": "log",
          "log": 10
        },
        "axisCenteredZero": false,
        "hideFrom": {
          "tooltip": false,
          "viz": false,
          "legend": false
        },
        "thresholdsStyle": {
          "mode": "off"
        }
      },
      "color": {
        "mode": "thresholds"
      },
      "mappings": [],
      "thresholds": {
        "mode": "absolute",
        "steps": [
          {
            "color": "green",
            "value": null
          }
        ]
      },
      "unit": "s"
    },
    "overrides": []
  },
  "gridPos": {
    "h": 10,
    "w": 12,
    "x": 0,
    "y": 17
  },
  "id": 37,
  "links": [],
  "options": {
    "orientation": "auto",
    "xTickLabelRotation": 0,
    "xTickLabelSpacing": 300,
    "showValue": "auto",
    "stacking": "none",
    "groupWidth": 0.7,
    "barWidth": 0.97,
    "barRadius": 0,
    "fullHighlight": false,
    "tooltip": {
      "mode": "multi",
      "sort": "none"
    },
    "legend": {
      "showLegend": false,
      "displayMode": "list",
      "placement": "bottom",
      "calcs": []
    },
    "xField": "Start time"
  },
  "pluginVersion": "10.1.4",
  "targets": [
    {
      "datasource": {
        "type": "jaeger",
        "uid": "ba9176e4-0b3b-437c-ab29-045d734b5b63"
      },
      "queryType": "search",
      "refId": "Traces",
      "service": "controller"
    }
  ],
  "title": "Trace Log",
  "transformations": [
    {
      "id": "sortBy",
      "options": {
        "fields": {},
        "sort": [
          {
            "field": "Start time",
            "desc": false
          }
        ]
      }
    }
  ],
  "type": "barchart"
} |
Example widget for universal extensions: Cloud Data Transfer
Max Avg. duration of file transfers
A stat graph showing the maximum average time for a Cloud Data Transfer task.

To configure the query we use the "sum by" and "increase" operators with 2 metrics that are divided by each other. For more clarity an override is added to change the color of the widget.
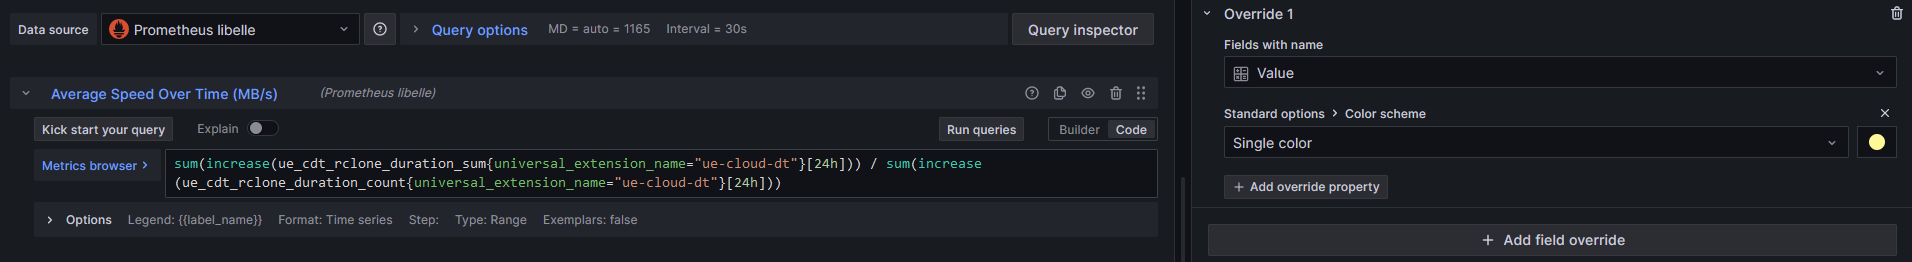
The code shown above is pasted here:
| Code Block |
|---|
sum(increase(ue_cdt_rclone_duration_sum{universal_extension_name="ue-cloud-dt"}[24h])) / sum(increase(ue_cdt_rclone_duration_count{universal_extension_name="ue-cloud-dt"}[24h])) |
The time interval can be changed to see determine the time period. This example was the max average in 24h.
Important is that under the general settings the calculation is set to the max number. This allows the query to only give the maximum amount of the calculated average.
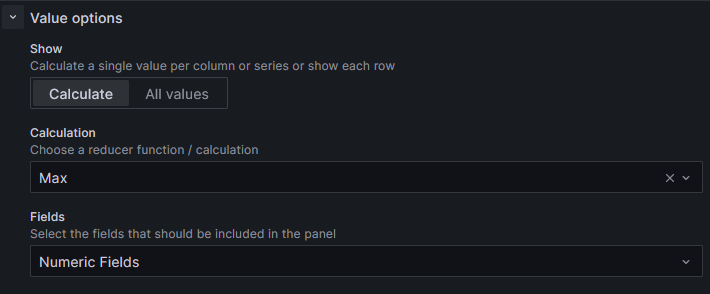
If the value on the stat graph is not shown in seconds it can help to set the units used to "seconds" this will force the stat graph to show the given value in seconds.
| Code Block | ||||||
|---|---|---|---|---|---|---|
| ||||||
{
  "datasource": {
    "uid": "a65085b5-82cf-490b-a6cb-c01306f4a949",
    "type": "prometheus"
  },
  "description": "Average Duration is computed within the Time Period selected. The Max value of it is displayed",
  "fieldConfig": {
    "defaults": {
      "mappings": [],
      "thresholds": {
        "mode": "absolute",
        "steps": [
          {
            "color": "green",
            "value": null
          }
        ]
      },
      "color": {
        "fixedColor": "super-light-yellow",
        "mode": "fixed"
      },
      "unit": "s"
    },
    "overrides": [
      {
        "matcher": {
          "id": "byName",
          "options": "Value"
        },
        "properties": [
          {
            "id": "color",
            "value": {
              "fixedColor": "super-light-yellow",
              "mode": "fixed"
            }
          }
        ]
      }
    ]
  },
  "gridPos": {
    "h": 4,
    "w": 4,
    "x": 0,
    "y": 1
  },
  "id": 20,
  "interval": "30",
  "options": {
    "reduceOptions": {
      "values": false,
      "calcs": [
        "max"
      ],
      "fields": ""
    },
    "orientation": "auto",
    "textMode": "auto",
    "colorMode": "value",
    "graphMode": "area",
    "justifyMode": "auto"
  },
  "pluginVersion": "10.1.4",
  "targets": [
    {
      "datasource": {
        "type": "prometheus",
        "uid": "a65085b5-82cf-490b-a6cb-c01306f4a949"
      },
      "disableTextWrap": false,
      "editorMode": "code",
      "expr": "sum(increase(ue_cdt_rclone_duration_sum{universal_extension_name=\"ue-cloud-dt\"}[24h])) / sum(increase(ue_cdt_rclone_duration_count{universal_extension_name=\"ue-cloud-dt\"}[24h]))",
      "fullMetaSearch": false,
      "includeNullMetadata": true,
      "instant": false,
      "interval": "",
      "legendFormat": "{{label_name}}",
      "range": true,
      "refId": "Average Speed Over Time (MB/s)",
      "useBackend": false
    }
  ],
  "title": "Max of Average duration",
  "type": "stat"
} |