Observability Start-Up Guide
- Stonebranch (Deactivated)
- Len-Maurice Seemann
- Peter Baljet
- Nils Buer
Introduction
What is Observability?
In the ever-evolving landscape of distributed system operations, ensuring the reliability, performance, and scalability of complex applications has become increasingly more difficult. System Observability has emerged as a critical practice that empowers IT organizations to effectively monitor and gain deep insights into the inner workings of their software systems. By systematically collecting and analyzing data about applications, infrastructure, and user interactions. Observability enables teams to proactively identify, diagnose, and resolve issues, ultimately leading to enhanced user experiences and operational efficiency.
What is OpenTelemetry?
OpenTelemetry is an open-source project that standardizes the collection of telemetry data from software systems, making it easier for organizations to gain holistic visibility into their environments. By seamlessly integrating with various programming languages, frameworks, and cloud platforms, OpenTelemetry simplifies the instrumentation of applications, allowing developers and operators to collect rich, actionable data about their systems' behavior. The adoption of OpenTelemetry by software vendors and Application Performance Monitoring (APM) tools represents a significant shift in the observability landscape. OpenTelemetry has gained substantial traction across the industry due to its open-source, vendor-neutral approach and its ability to standardize telemetry data collection.
Many software vendors have started incorporating OpenTelemetry into their frameworks and libraries. Major cloud service providers like AWS, Azure, and Google Cloud have also embraced OpenTelemetry. In addition, many APM tools have integrated OpenTelemetry into their offerings. This integration allows users of these APM solutions to easily collect and visualize telemetry data from their applications instrumented with OpenTelemetry. It enhances the compatibility and flexibility of APM tools, making them more versatile in heterogeneous technology stacks.
Solution Architecture (Component Description)
.png?version=1&modificationDate=1696277053199&cacheVersion=1&api=v2&width=420&height=250)
Getting Started
Introduction
The following will provide a example setup to get started with Observability using Grafana for Universal Automation Center.
This set-up is based on the setup done with Grafana.
This set-up allows collecting Metrics, Trace and Log data from the Universal Automation Center. The collected data is stored your Grafana’s cloud stack for analysis.
Grafana is selected for this Getting Started Guide as an example. Any other data store or analysis tool could also be used.
Metrics
Metrics data can be collected from Universal Controller, Universal Agent, OMS and Universal Tasks of type Extension.
Metrics data is pulled through the Prometheus metrics Web Service endpoint (Metrics API) and via user-defined Universal Event Open Telemetry metrics, which is exported to the Grafana Alloy Agent metrics collector.
The collected Metrics data is exported to your Grafana Cloud Stack for analysis.
To enable Open Telemetry metrics, the Prometheus exporter block needs to be configured in the config file of Grafana Alloy.
Trace
Universal Controller will manually instrument Open Telemetry trace on Universal Controller (UC), OMS, Universal Agent (UA), and Universal Task Extension interactions associated with task instance executions, agent registration, and Universal Task of type Extension deployment.
The collected Trace data is stored in your Grafana Cloud Stack for analysis.
To enable tracing an Open Telemetry span exporter must be configured in Grafana Alloy.

Prerequisites
The sample set will be done on a single on-premise Linux server and Grafana Cloud.
Server Requirements
- Linux Server
- Memory: 16GB RAM
- Storage: 70GB Net storage
- CPU: 4 CPU
- Distribution: Any major Linux distribution
- For the installation and configurations of the required Observability tools Administrative privileges are required
- Ports
The Following default ports will be used.
Application | Port |
|---|---|
| Grafana Alloy "Prometheus" | http: 9090 |
| Grafana Alloy "OTEL Collector" | 4317 (grpc), 4318 (http) |
Pre-Installed Software Components
It is assumed that following components are installed and configured properly:
- Universal Agent 7.5.0.0 or higher
- Universal Controller 7.5.0.0 or higher
Please refer to the documentation for Installation and Applying Maintenance
and Universal Agent UNIX Quick Start Guide for further information on how to install Universal Agent and Universal Controller.
Required Software for Observability
The following Opensource Software needs to be installed and configured for use with Universal Automation Center.
Note: This Startup Guide has been tested with the provide Software Version in the table below.
| Software | Version | Linux Archive |
|---|---|---|
| Grafana Alloy | 1.43 | https://github.com/grafana/alloy/releases |
Configuration
Grafana Alloy setup
Set up a Grafana Cloud Account
To start using Observability using Grafana a Grafana Cloud Account is needed. This can be done on Grafana's Website. There is an unlimited free trial that allows for Data retention up to 14 days.
Once an account is created Grafana will set-up an Instance where all Observability data is getting sent to.
Setup Grafana Alloy
To get Observability data into your Grafana Cloud stack, Grafana Alloy is needed.
For a detailed installation guide and how to set-up Grafana Alloy on your own the Grafana Alloy documentation can help.
Installing Grafana Alloy is done by using the local package repository on your System.
Grafana Alloy is getting installed as a system service on your System, in which the environment variables for the Grafana Cloud stack needs to be configured.
To edit the environment file for the service head to either:
- Debian-based systems: /etc/default/alloy
- RedHat or SUSE-based systems: /etc/sysconfig/alloy
It is also recommended to change the user running alloy to the same user that runs the Universal Controller in order for the log data to get collected. The following shows an example of the system config file:
Once the changes are made use the following commands:
sudo systemctl daemon-reload
sudo systemctl restart alloy
In order to start Grafana Alloy with the new environmental variables.
Configuring Grafana Alloy
To configure Grafana Alloy the configuration file needs to be changed at “/etc/alloy/config.alloy”
It follows a pipeline format in which data sent to Grafana Alloy is received, processed and sent to the Grafana Cloud stack.
There are multiple additional configurations that can be made to make ingesting your Observabiltiy data easier and efficient.
To find more information about the different "Code Blocks" for the config head to the official Grafana documentation for Alloy
The following configuration is an example set-up in order to collect Metric/Trace/Log data.
Once restarting Grafana Alloy will collect Observability data from your Universal Controller. The log file of Grafana Alloy can be checked by using the command: “sudo journalctl -u alloy.service”.
Universal Controller
Description:
Universal Controller
Installation Steps:
Update Universal Controller Properties
The following uc.properties need to be set in order to enable metrics and traces from Universal Controller:
| Name | Description |
|---|---|
| uc.otel.exporter.otlp.metrics.endpoint | The OTLP metrics endpoint to connect to. Must be a URL with a scheme of either http or https based on the use of TLS. Default is http://localhost:4317 when protocol is grpc, and http://localhost:4318/v1/metrics when protocol is http/protobuf. |
| uc.otel.exporter.otlp.traces.endpoint | The OTLP traces endpoint to connect to. Must be a URL with a scheme of either http or https based on the use of TLS. Default is http://localhost:4317 when protocol is grpc, and http://localhost:4318/v1/traces when protocol is http/protobuf |
Please refer to the uc.properties documentation for a list of all configuration options.
Sample Configuration Files
The following provides a minimum uc.properties file:
uc.properties

# Enable metrics and trace from UC Controller

# The OTLP traces endpoint to connect to (grpc):
uc.otel.exporter.otlp.traces.endpoint http://localhost:4317

# The OTLP metrics endpoint to connect to (grpc):
uc.otel.exporter.otlp.metrics.endpoint http://localhost:4317
Universal Agent
Description:
The following describes the steps to enable tracing and metrics for UAG and OMS Server.
The here described set-up use http protocol. In addition to supporting HTTP (default), HTTPS is also supported.
Refer to the documentation on how to Enable and Configure SSL/TLS for OMS Server and UAG:
Installation Steps:
Enabling Metrics/Traces
Metrics and Traces will be turned off, by default, in both UAG and OMS Server. The user must configure two new options to enable metrics and traces.
Metrics:
| Component | Configuration File Option |
|---|---|
| UAG | otel_export_metrics YES |
| OMS Server | otel_export_metrics YES |
Traces:
| Component | Configuration File Option |
|---|---|
| UAG | otel_enable_tracing YES |
| OMS Server | otel_enable_tracing YES |
Configure Service Name
All applications using Opentelemetry must register a service.name, including UAG and OMS Server
| Component | Configuration File Option |
|---|---|
| UAG | otel_service_name <agent_name> |
| OMS Server | otel_service_name <oms_agent_name> |
Configuring OTLP Endpoint
Both the metrics and tracing engines end up pushing the relevant data to the Opentelemetry collector using the HTTP(S) protocol (gRPC protocol
NOT supported this release). In most scenarios, the traces and metrics will be sent to the same collector, but this is not strictly necessary. To
account for this, two new options will be added in both UAG and OMS
Metrics:
| Component | Configuration File Option |
|---|---|
| UAG | otel_metrics_endpoint http://localhost:4318 |
| OMS Server | otel_metrics_endpoint http://localhost:4318 |
Traces:
| Component | Configuration File Option |
|---|---|
| UAG | otel_trace_endpoint http://localhost:4318 |
| OMS Server | otel_trace_endpoint http://localhost:4318 |
Configure how often to export the metrics from UAG and OMS Server
| Component | Configuration File Option |
|---|---|
| UAG | otel_metrics_export_interval 60 |
| OMS Server | otel_metrics_export_interval 60 |
The value:
Opentelemetry default of 60 seconds
is specified in seconds
must be non-negative (i.e. >0)
cannot exceed 2147483647
Sample Configuration Files
The following provides the sample set-up for UAG and OMS Server.
The otel_metrics_export_interval is not set. The default value of 60s is taken in that case.
# /etc/universal/uags.conf:

otel_export_metrics YES
otel_enable_tracing YES
otel_service_name agt_lx_wiesloch_uag
otel_metrics_endpoint http://localhost:4318
otel_trace_endpoint http://localhost:4318
# /etc/universal/omss.conf:

otel_export_metrics YES
otel_enable_tracing YES
otel_service_name agt_lx_wiesloch
otel_metrics_endpoint http://localhost:4318
otel_trace_endpoint http://localhost:4318
Note: After adjusting uags.conf and omss.conf restart the Universal Agent.
sudo /opt/universal/ubroker/ubrokerd restart
Official Documentation: Links to OMS and UAG open telemetry configuration options.
Universal Automation Center Observability Tutorials
Tutorial 1: Metric Data Collection and Analysis using Grafana
Configure a sample Dashboard in Grafana (add prometheus datasource, create visualization)
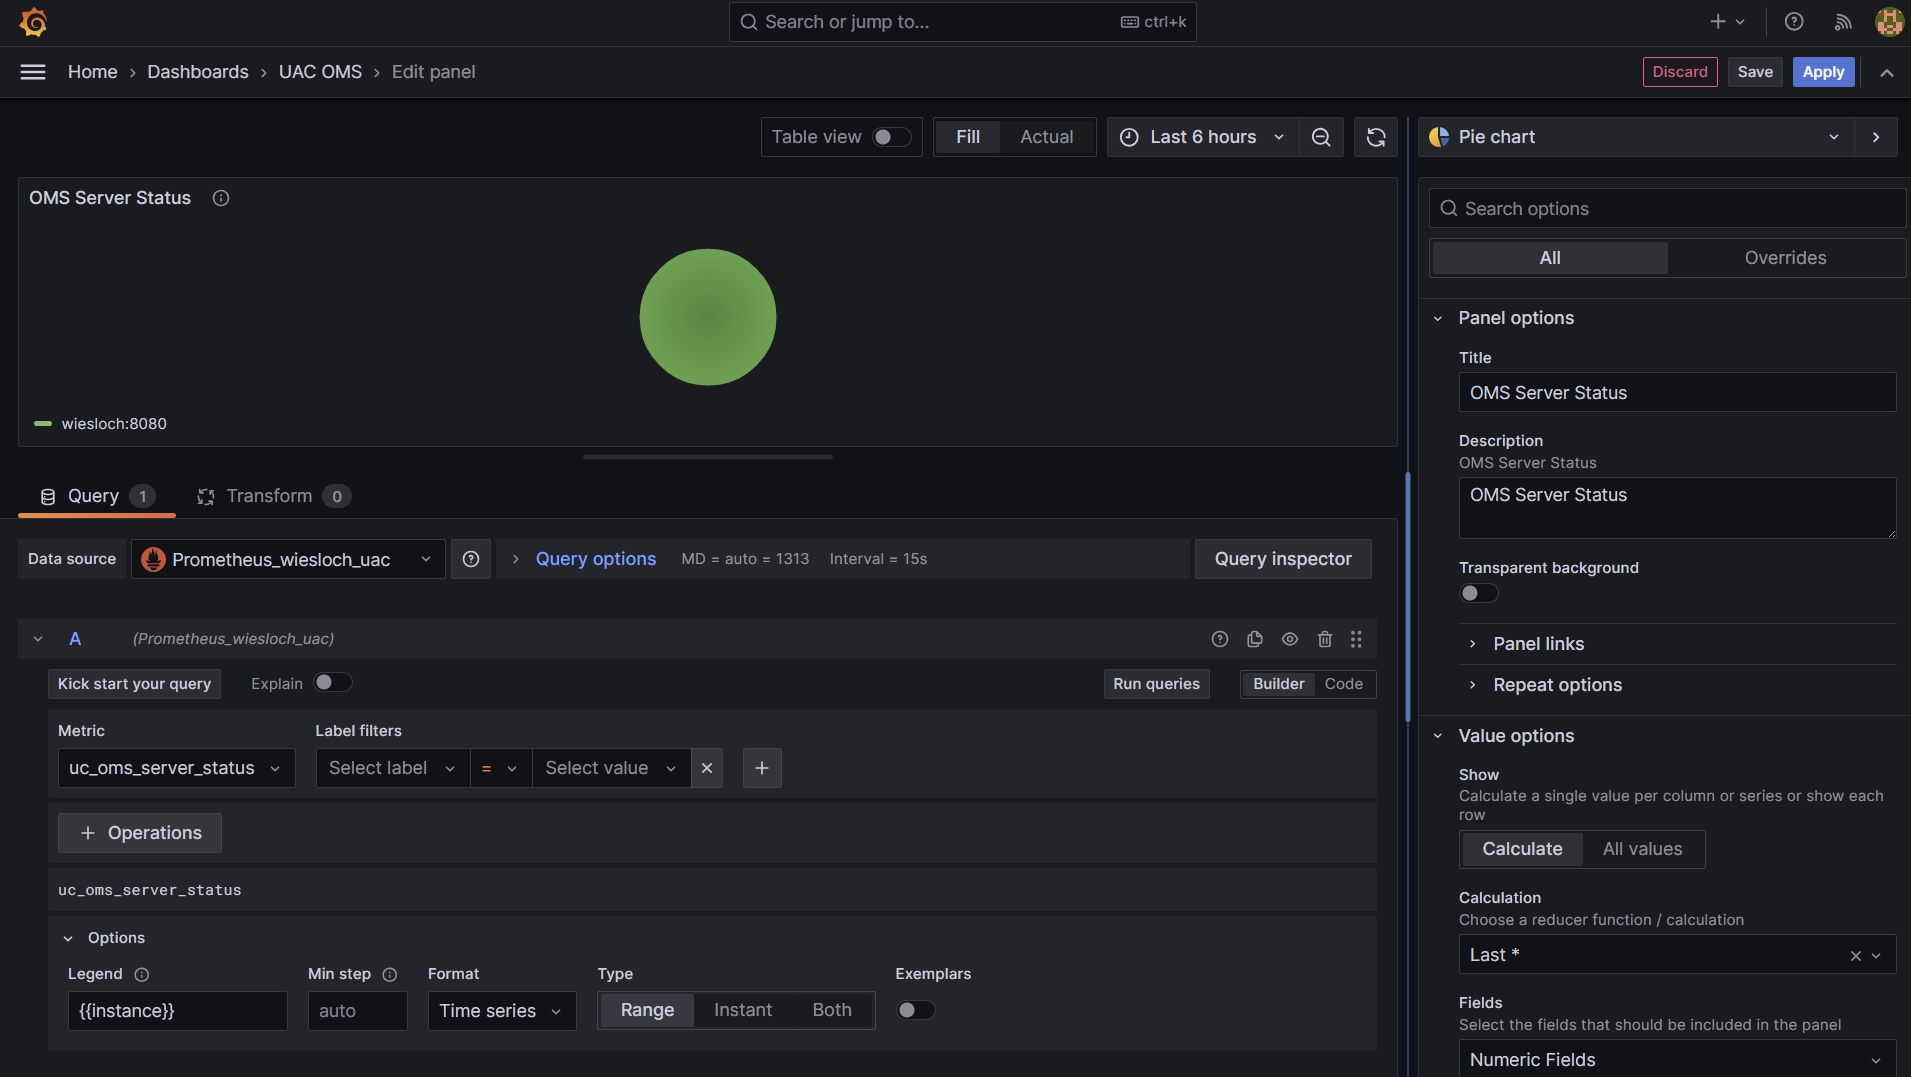
In the following example, a Grafana Dashboard with one visualization showing the OMS Server Status will be configured. The datasource is automatically configured by Grafana Alloy.
The following Steps need to be performed:
- Log-in to Grafana
- Create a new Dashboard and add a new visualization to it
- Configure visualization
- Display Dashboard
Log-in to your Grafana Instance
Create a new Dashboard and add a new visualization to it
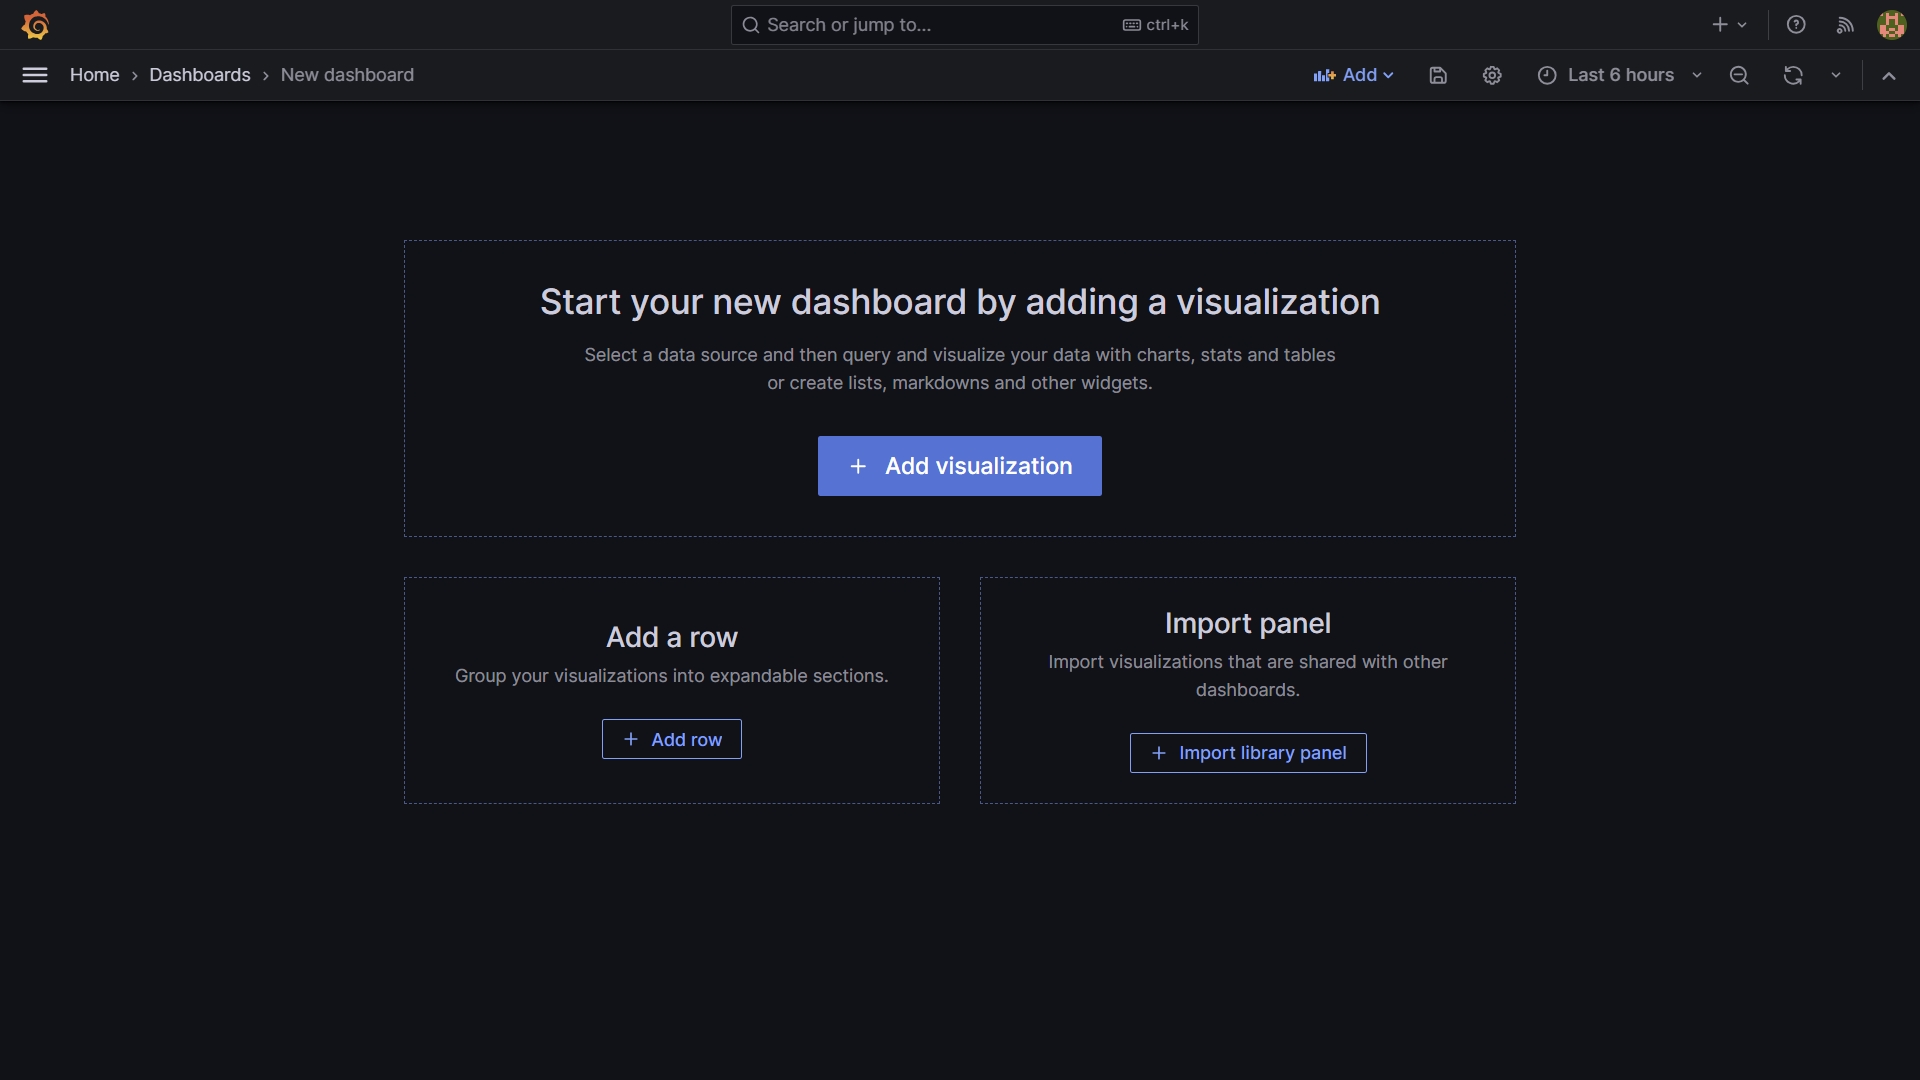
Configure Visualization
- Select Prometheus as Data Source
- Select the Metric uc_oms_server_status
- Enter a Title and Description e.g. OMS Server Status
- In the Legend Options enter {{instance}}
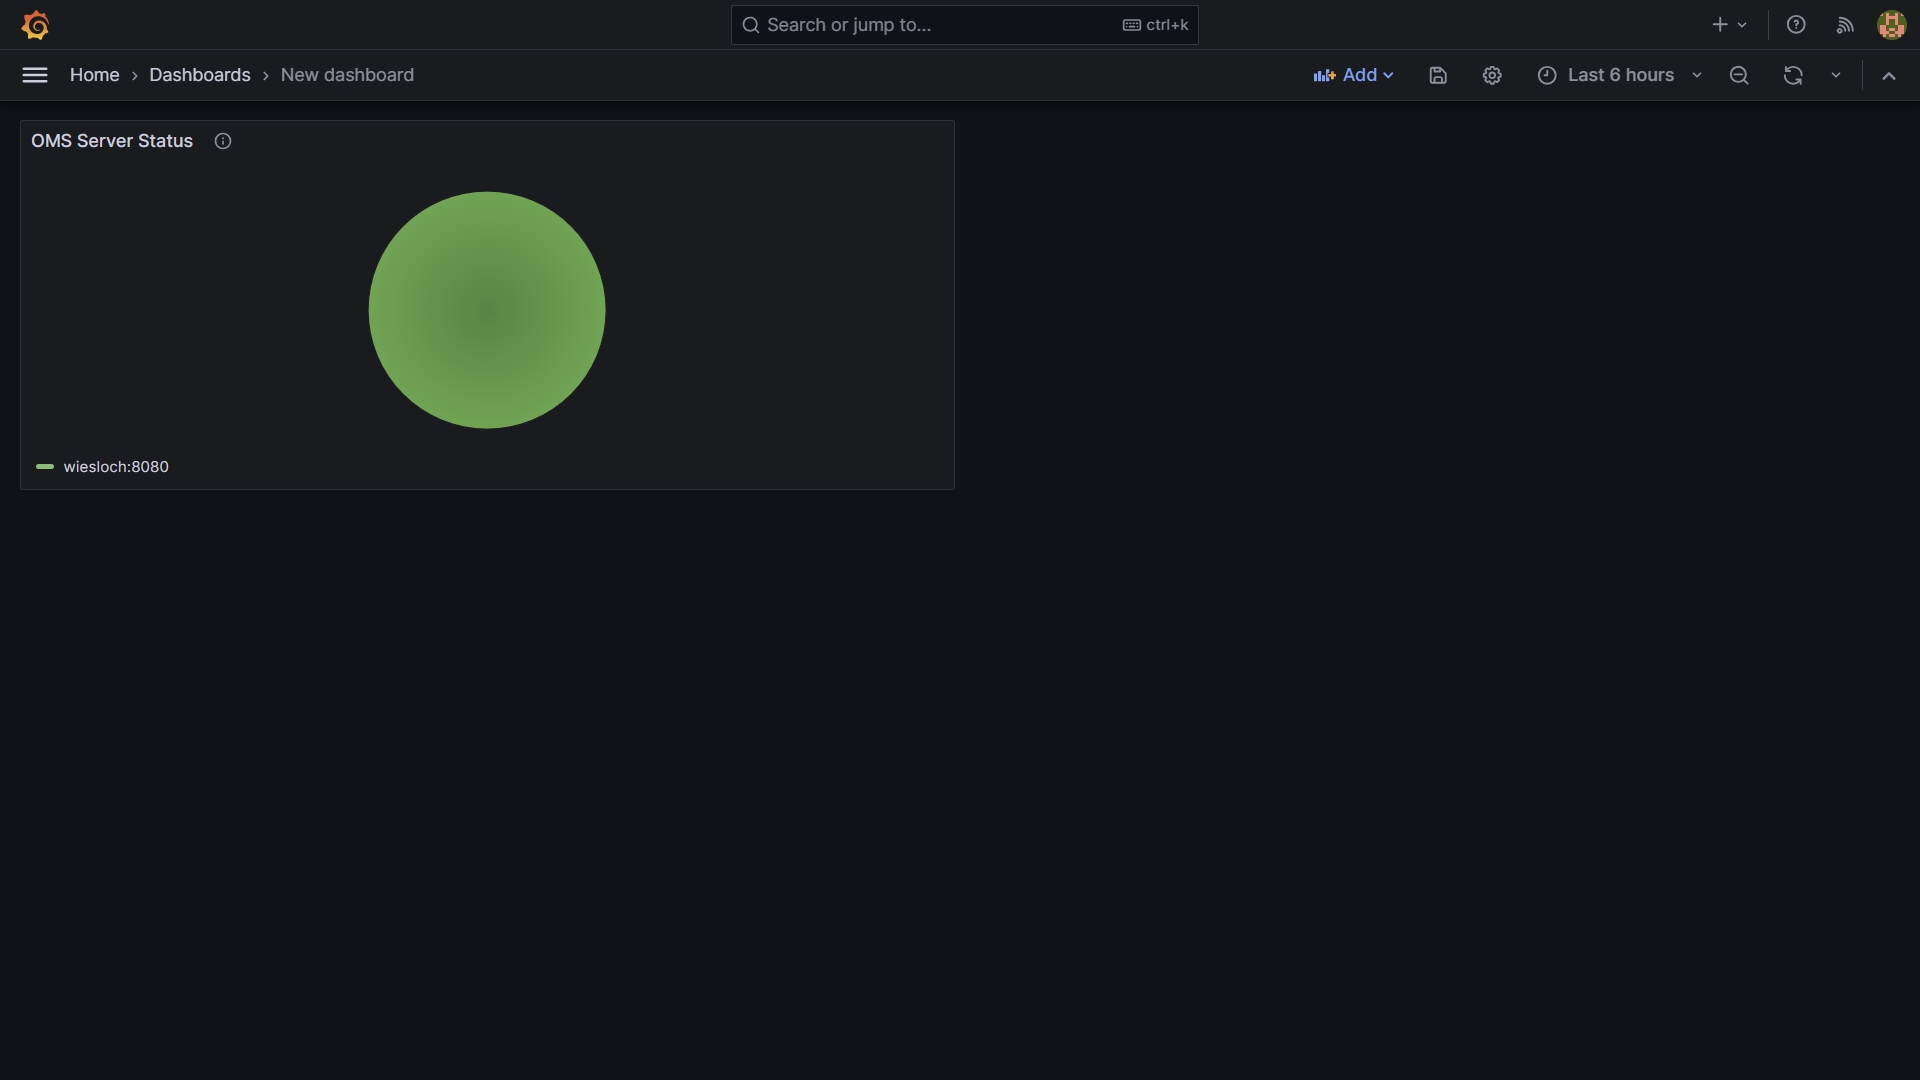
Display Dashboard
Tutorial 2: Traces Data Collection and Analysis using Grafana
This tutorial will show how to collect and visualize traces from the different UAC components in Grafana.
This tutorial requires that all configuration steps from the Observability Start-Up Guide have already been performed.
After finishing this Tutorial, you will be able to collect and display Metrics and Traces in Grafana
Universal Controller will manually instrument Open Telemetry trace on Universal Controller (UC), OMS, Universal Agent (UA), and Universal Task Extension interactions associated with task instance executions, agent registration, and Universal Task of type Extension deployment.
To enable tracing, an Open Telemetry span exporter must be configured in Grafana Alloy.
The collected Trace data is used for analysis in Grafana.
The following outlines the architecture:
Installation
Prerequisites
This tutorial requires that all configuration steps from the Observability Start-Up Guide have been already performed.
Server Requirements
the same Linux Server as in the first part of the Tutorial will be used.
Pre-Installed Software Components
This tutorial requires the following software, installed during the first Tutorial.
Software | Version | Linux Archive |
|---|---|---|
Universal Controller | 7.5.0.0 or higher | Download via Stonebranch Support Portal |
Universal Agent | 7.5.0.0 or higher | Download via Stonebranch Support Portal |
| Grafana Alloy | 1.43 or higher | https://github.com/grafana/alloy/releases |
1. Enable Tracing in Universal controller
Update uc.properties
Official Documentation: link to uc.properties open telemetry properties.
Start/ Stop Tomcat
Checks
2. Enable Tracing in Universal Agents
For the endpoint give the IP address of the System on which Grafana Alloy is running.
Configure uags.conf and omss.conf of the Universal Agent
Start/Stop
Checks
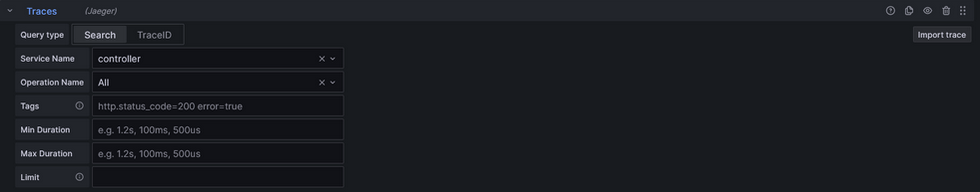
3. Configure a sample tracing dashboard in Grafana (create visualization, view trace)
In this example, a Grafana dashboard with one tracing visualization showing incoming traces from the controller will be configured. The datasource is automatically configured by Grafana Alloy
The following steps need to be performed:
- Log-in to Grafana
- Create or access a dashboard and add a visualization
- Configure the visualization with the Grafana Tempo data source set
- Click on a trace to open detailed information about the trace
Log-in to Grafana
Head to the dashboards tab and create/access a dashboard and add a visualization to the dashboard
Configure the visualization: (Examples)
- Select the Tempo data source
- Select the "search" tab for a general view of traces or the "traceid" tab for a specific trace
- Choose the controller as the service name and choose "all" operation names
- Add the "sort by" transformation set to start time
- Select that all tooltips should be shown
- Save the visualization
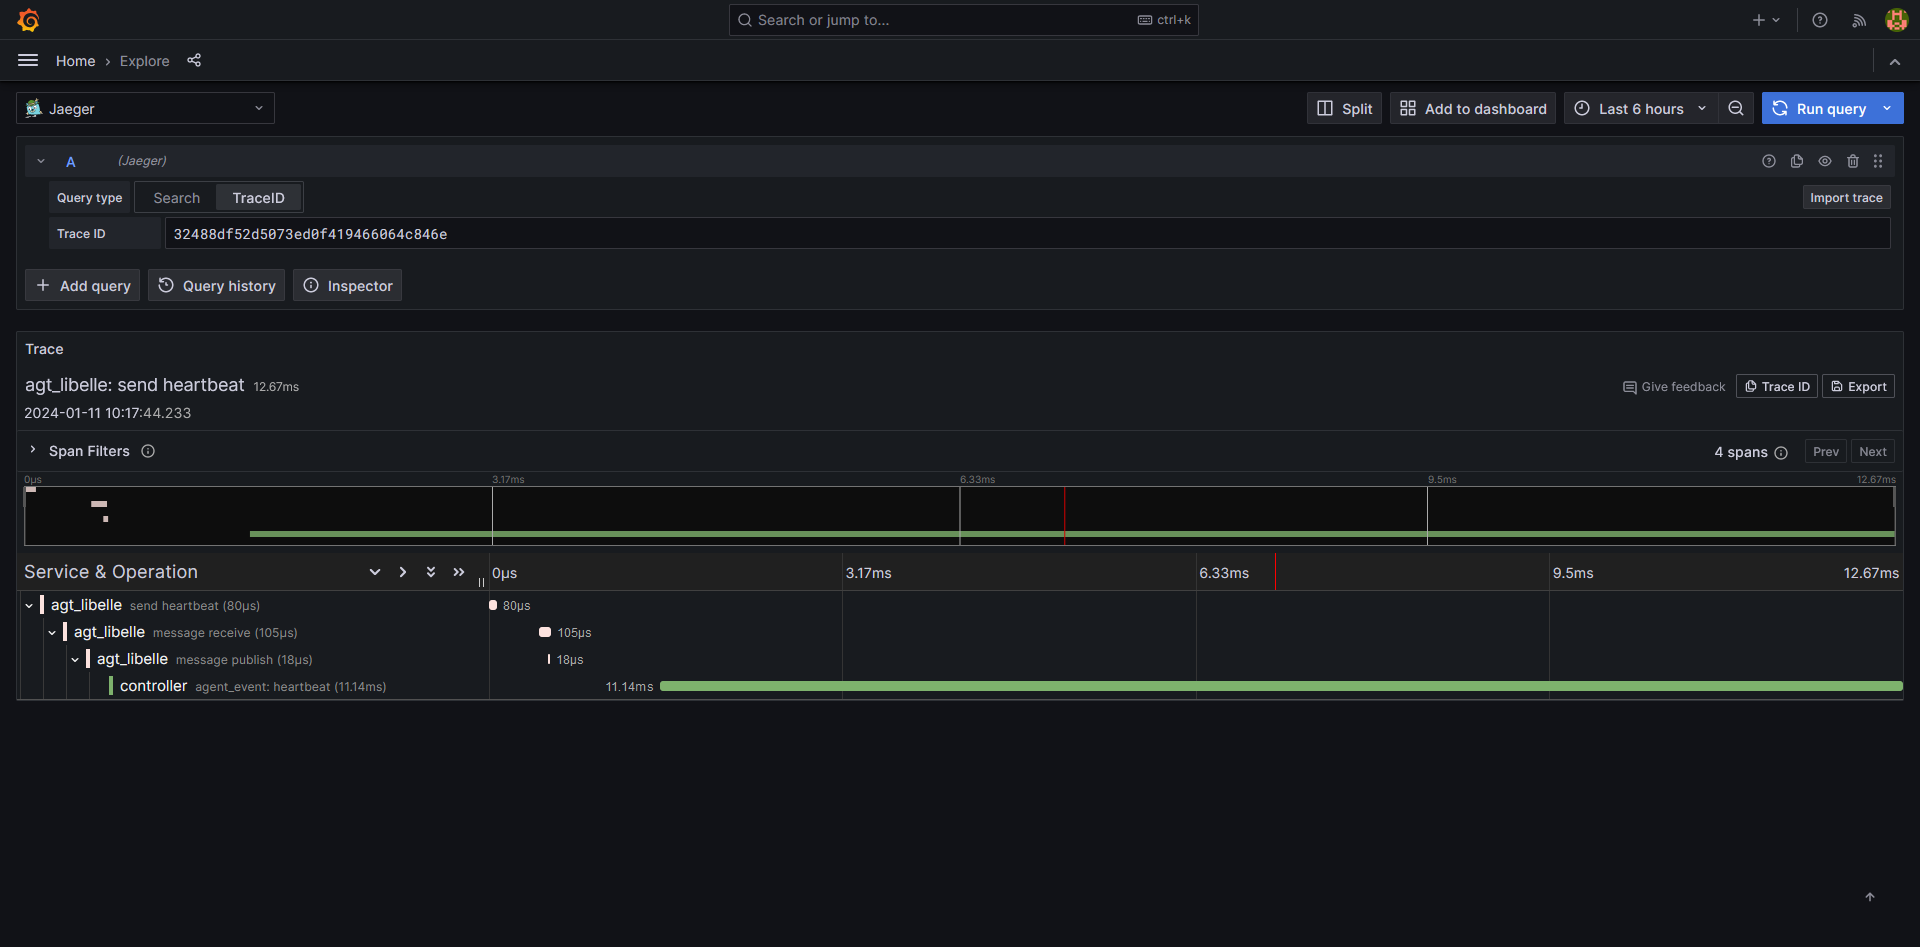
Click on a given trace and open the link in a new tab
The trace will now be shown in a detailed view
Example Widgets inside of Grafana
Grafana has sharing options for Dashboards or Widgets. Copying the JSON model of one of the widgets and pasting it will result in the Widget being present in the dashboard, make sure beforehand that your datasource is set up correctly and double check the widget if there are any problems.
List of Business Services with detailed view (advanced)
Making a List of Business services

Despriction:
This Widget allows for a list of Business services available on the Universal Controller. Clicking one of the Business services will open a nested dashboard which will give more detailed information about the Business service.
This Widget requires the optional metric label "security_business_service" in order to function properly.
Configuration:
The Widget uses the "uc_history_total" metric and the "Time series to table" transformation, the transformation is available from Grafana.
The metric is filtered by the current instance, if you have multiple and summarized by the "security_business_services" label.

Under the Transformation tab choose the "Time series to table" transformation and set it to the following setting:

Changing the Widget type to "Table" will now result in the above seen Widget with the task number of launched tasks.
To not let the number of tasks launched be seen it is possible to set an overide in the Widget editor.

Now we set up a new dashboard for the detailed view of the business services.
It is recommended to use the template dashboard given below and pasting it as a new dashboard for a quick out-of-the-box-experience. This dashboard is configured to use the default prometheus data source provided by Grafana and uses several variables already pre-set up.
To connect the two dashboards, head back to the Widget and add a "Data Link" with the following link:

Use the UUID of the pasted dashboard after the "d/" in order to connect the dashboards.
This concludes the setup of the Business service widget.
Widgets for System data (Agents, OMS)
Number of Agents connected
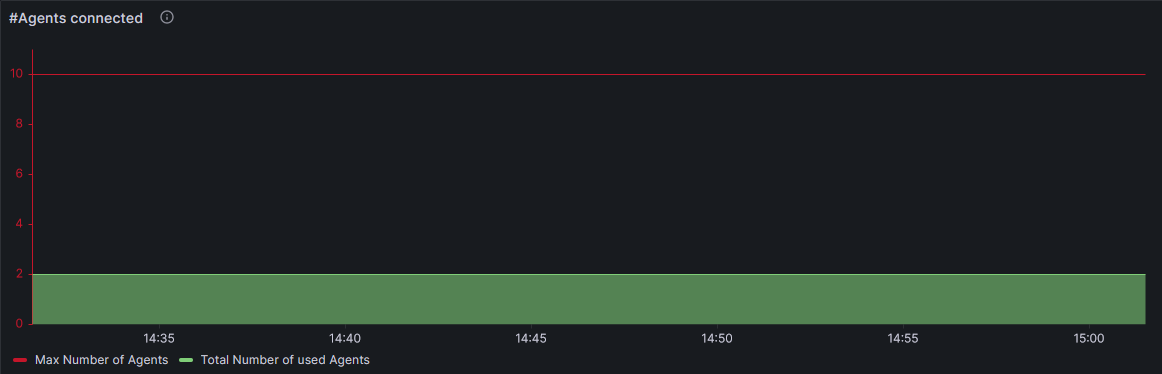
Description:
This Widget shows the number of Agents connected and has an indicator for the upper limit of how many Agents can connect to the controller.
The upper limit depends on the number of licenses the controller owns.
This Widget uses the “Time series” configuration to give a real time update on the Agent status.
Configuration:
The Widget is constructed using 2 metrics derived from the controller:
The first query is the “uc_license_agents_distributed_max” metric which will show the maximum amount of licenses available, which is used to show the upper limit graph.
The second query is the “uc_license_agents_distributed_used” metric which shows the amount of Agents currently connected to the controller.
Seen below is an example of the configuration used to make it an opaque graph that runs through the time series.
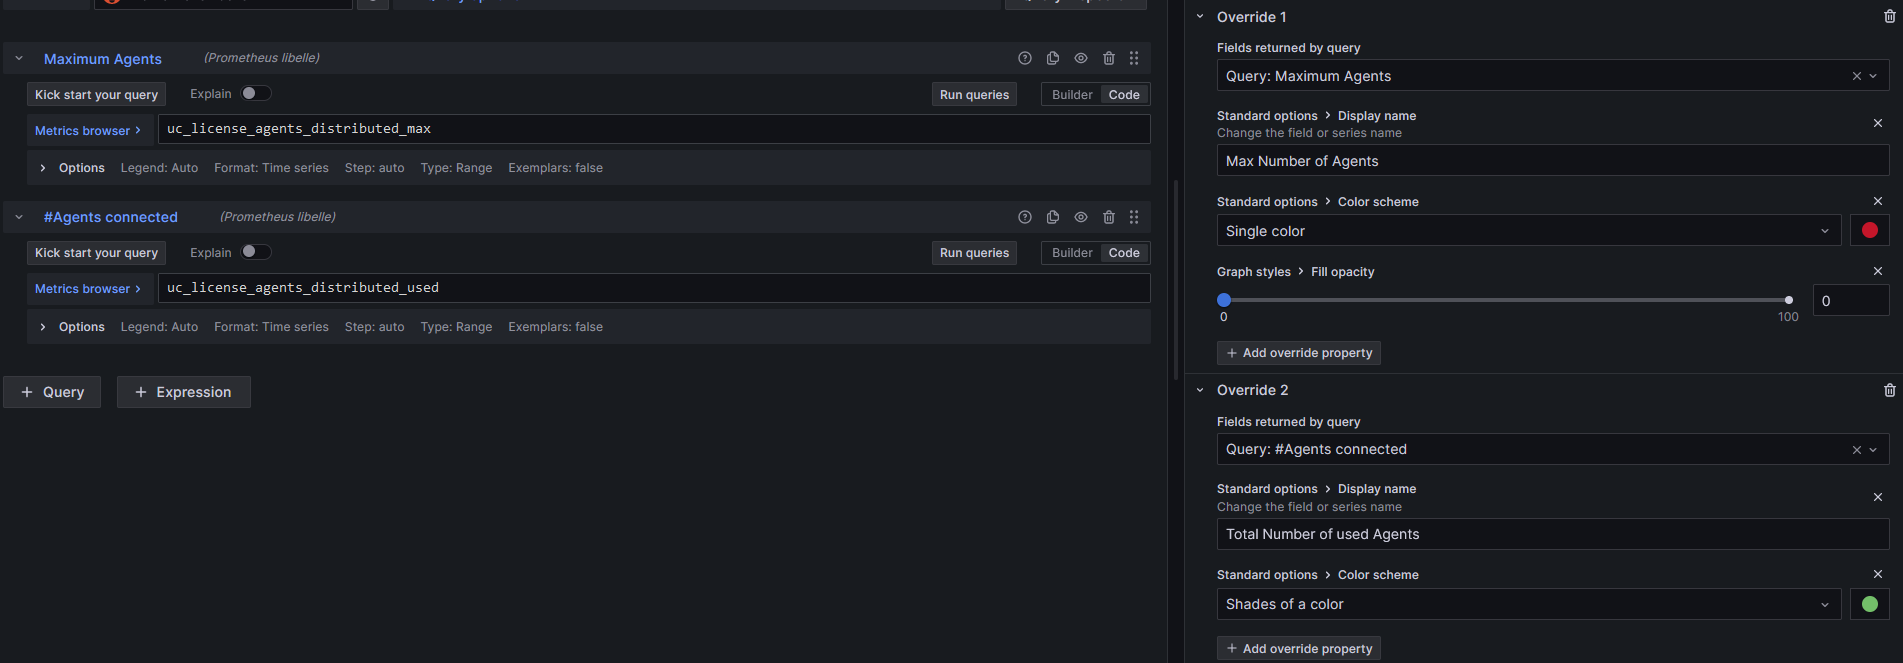
Below are the 2 PromQL lines used to configure the queries
uc_license_agents_distributed_max
uc_license_agents_distributed_used
OMS Server Status
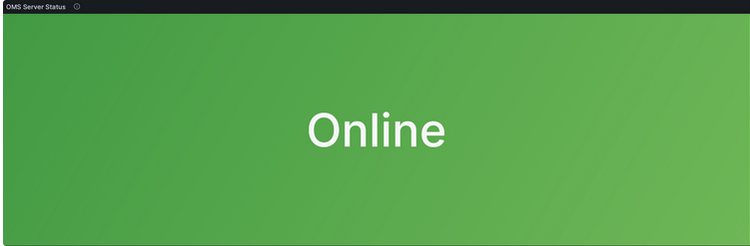
Description:
OMS Server Status shown in a "Status History" graph. Depending on the number of OMS server connected the graph changes to represent them.
The graph will also show the different states an OMS server can be.
Configuration:
This query is made from the “uc_oms_server_status” metric using the code
sum by(instance) (uc_oms_server_status)
The metric can send 3 different types of values depending on the OMS status. 1 for “running”, 0 for “not running”, -1 for “in doubt”.
To ensure the Widget shows this information we change add value mappings for the different states the server can be.

Active OMS Server Client connections
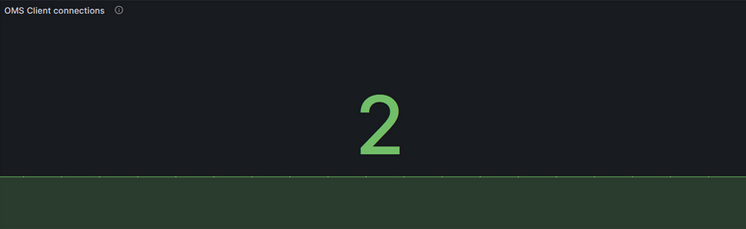
Description:
Widget that shows how many Clients are connecting to an OMS server. It will count the connections from agents and controller that connect to the OMS server.
Configuration:
This query uses the “ua_active_connections” metric to read out the number of active connections to all OMS server and showing them using the “Stats” graph.
To set up the Widget, select the metric using the metrics browser or paste the following line in the code builder of Grafana:
sum by(instance) (ua_active_connections)
As more OMS servers are sending metrics to the OTelCollector, the stats graph will update to represent them.
Furthermore on the settings on the right side under the “Value mappings” tab we add a note that says "0 → No active connections"

Widgets for observing Tasks and Task statuse
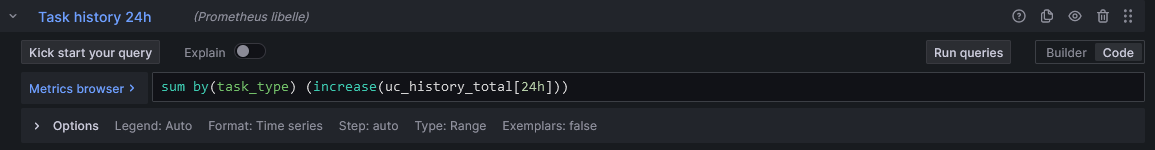
Tasks started in a set time period
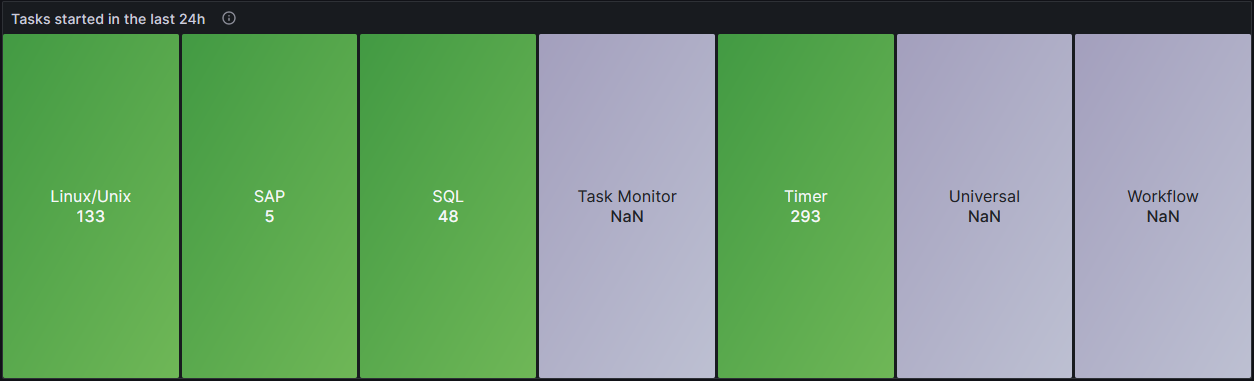
Description:
This “Stat” graph is showing how many tasks have been created in a time period that can be specified. This example shows the Tasks from a 24h time period.
Configuration:
To create this Widget, we use the “uc_history_total” metric to receive all the data from tasks of the universal controller and universal agent.
When creating the query, use the metric browser to find the “uc_history_total” metric and choose the operations “Increase” from the “Range functions” tab and the “Sum” from the Aggregations tab.
Label the “Increase” range to the specified time period you wish to observe (in the example, 24h) and set the “Sum by” label to “task_type”.
The code builder should now look like this:
sum by(task_type) (increase(uc_history_total[24h]))
Task duration split of tasks launched in a time period
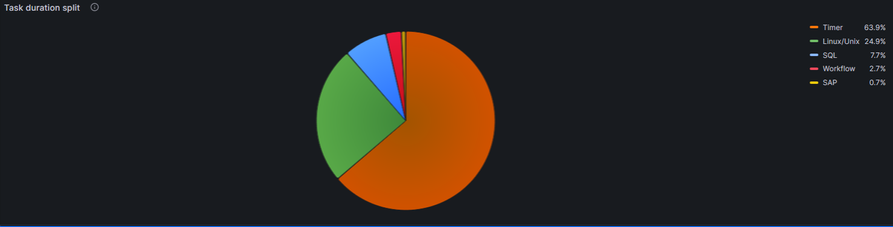
Description:
This “Stat” graph is showing how many tasks have been created in a time period that can be specified. This example shows the Tasks from a 24h time period.
Configuration:
To create this Widget, we use the “uc_history_total” metric to receive all the data from tasks of the universal controller and universal agent.
When creating the query, use the metric browser to find the “uc_history_total” metric and choose the operations “Increase” from the “Range functions” tab and the “Sum” from the Aggregations tab.
Label the “Increase” range to the specified time period you wish to observe (in the example 24h) and set the “Sum by” label to “task_type”.
The code builder should now look like this:
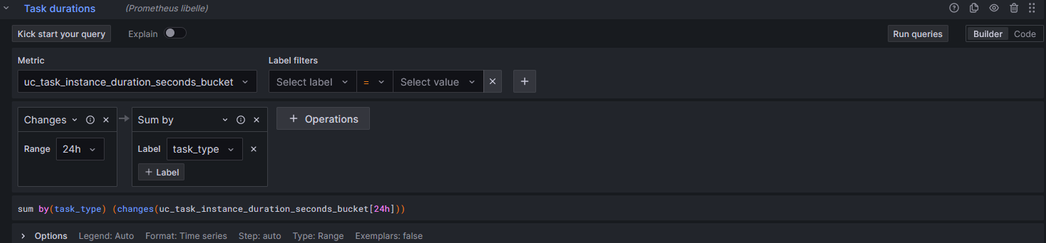
You can also add this line of code directly into the code tab to receive the settings:
sum by(task_type) (changes(uc_task_instance_duration_seconds_bucket[24h]))
It is important that in the standard options tab of the general settings the unit is set to “duration (s)” and the decimal point is set to at least 1 decimal point for more accuracy.
Successful/Late Finish ratio shown in a Pie chart of a given Task type
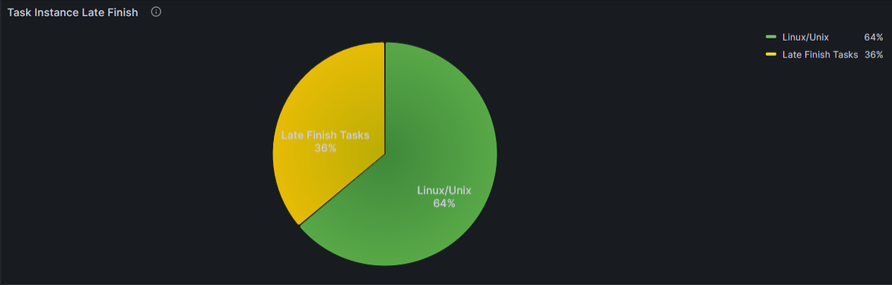
Description:
Pie chart which shows the percentage of "Late Tasks" in reference to the total amount of tasks (Last 1h in this example; Linux Tasks in this example).
Configuration:
This pie chart is made up of 2 queries that will represent the ratio of “Late Finish” Tasks and “successful” Tasks.
The first query is made from using the “uc_task_instance_late_finish_total” metric and using a label filter on the specified Task we want to observe.
Using the Operator “Delta” gives the query a time period to observe the metric data. (In this example it is 1h).
The “Sum by” is set to “task_type” to ensure all metric data of the specified task is displayed.
Using an “Override” we name the query for the pie chart and set a color.
The second query is made up of the “uc_history_total” and the “uc_task_instance_late_finish_total” metric and subtracting them the “Late Finish” tasks from the total.
Similar to the first query we specify a time period using the “Delta” operator and the “Sum by” operator, as well as set the label filter to the tasks we observe.
Using a “Binary operations with query” operator allows for the second metric to be set as the “uc_task_instance_late_finish_total” metric and set to the same as the first query.
Using the “-” in the operation will result in all tasks being shown once and not be counted a second time for the pie chart.
Using the “Override” we set a color and optionally a name for the pie chart.
The code for the queries is below:
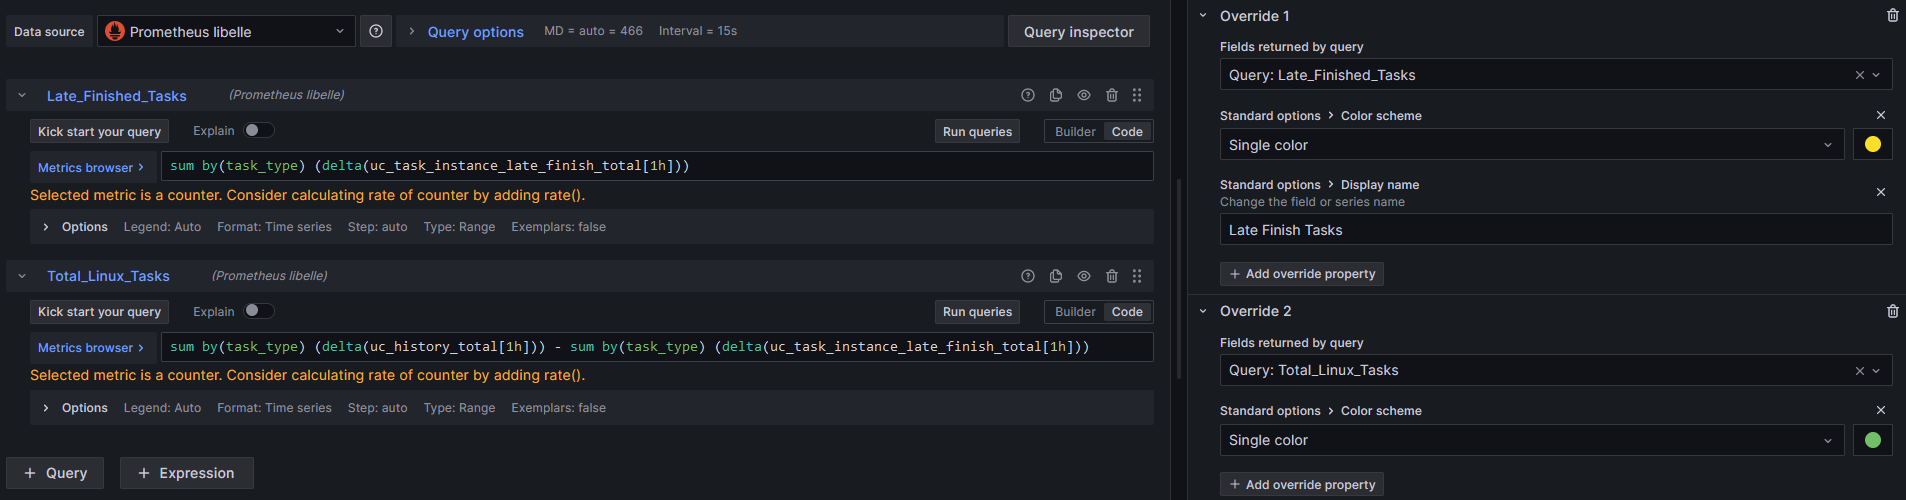
first query
sum by(task_type) (delta(uc_task_instance_late_finish_total[1h]))
second query
sum by(task_type) (delta(uc_history_total[1h])) - sum by(task_type) (delta(uc_task_instance_late_finish_total[1h]))
Widgets for Traces
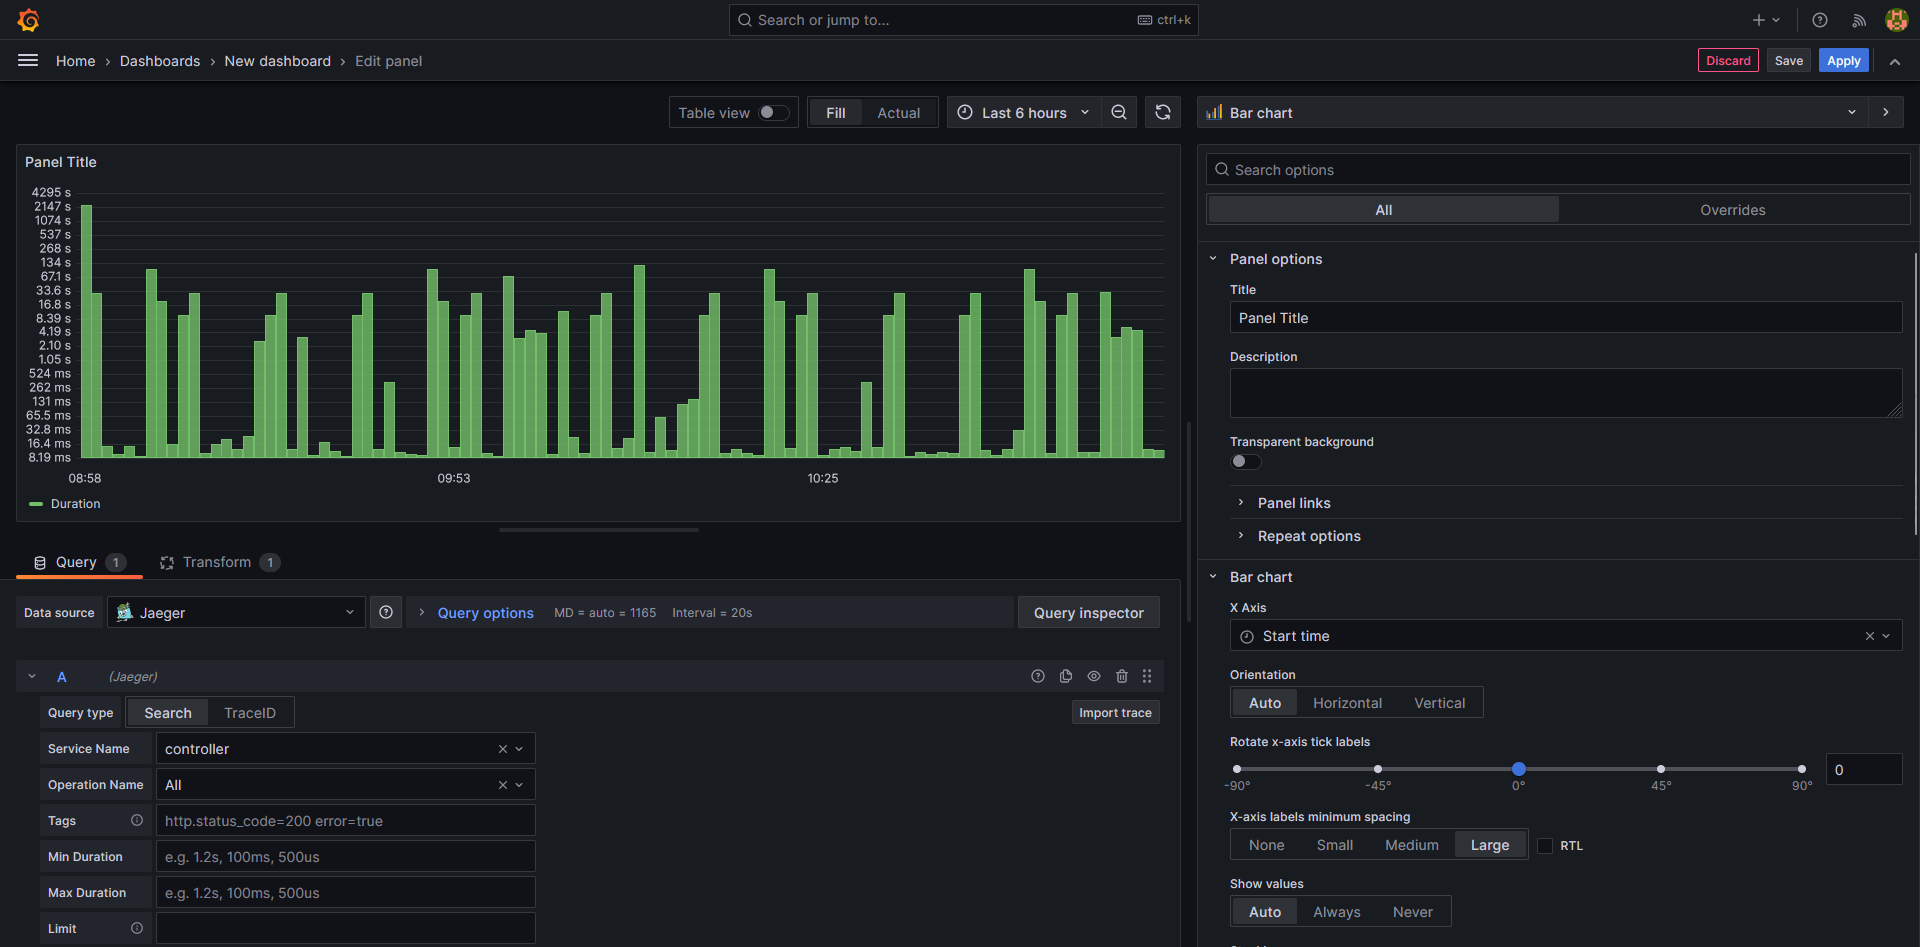
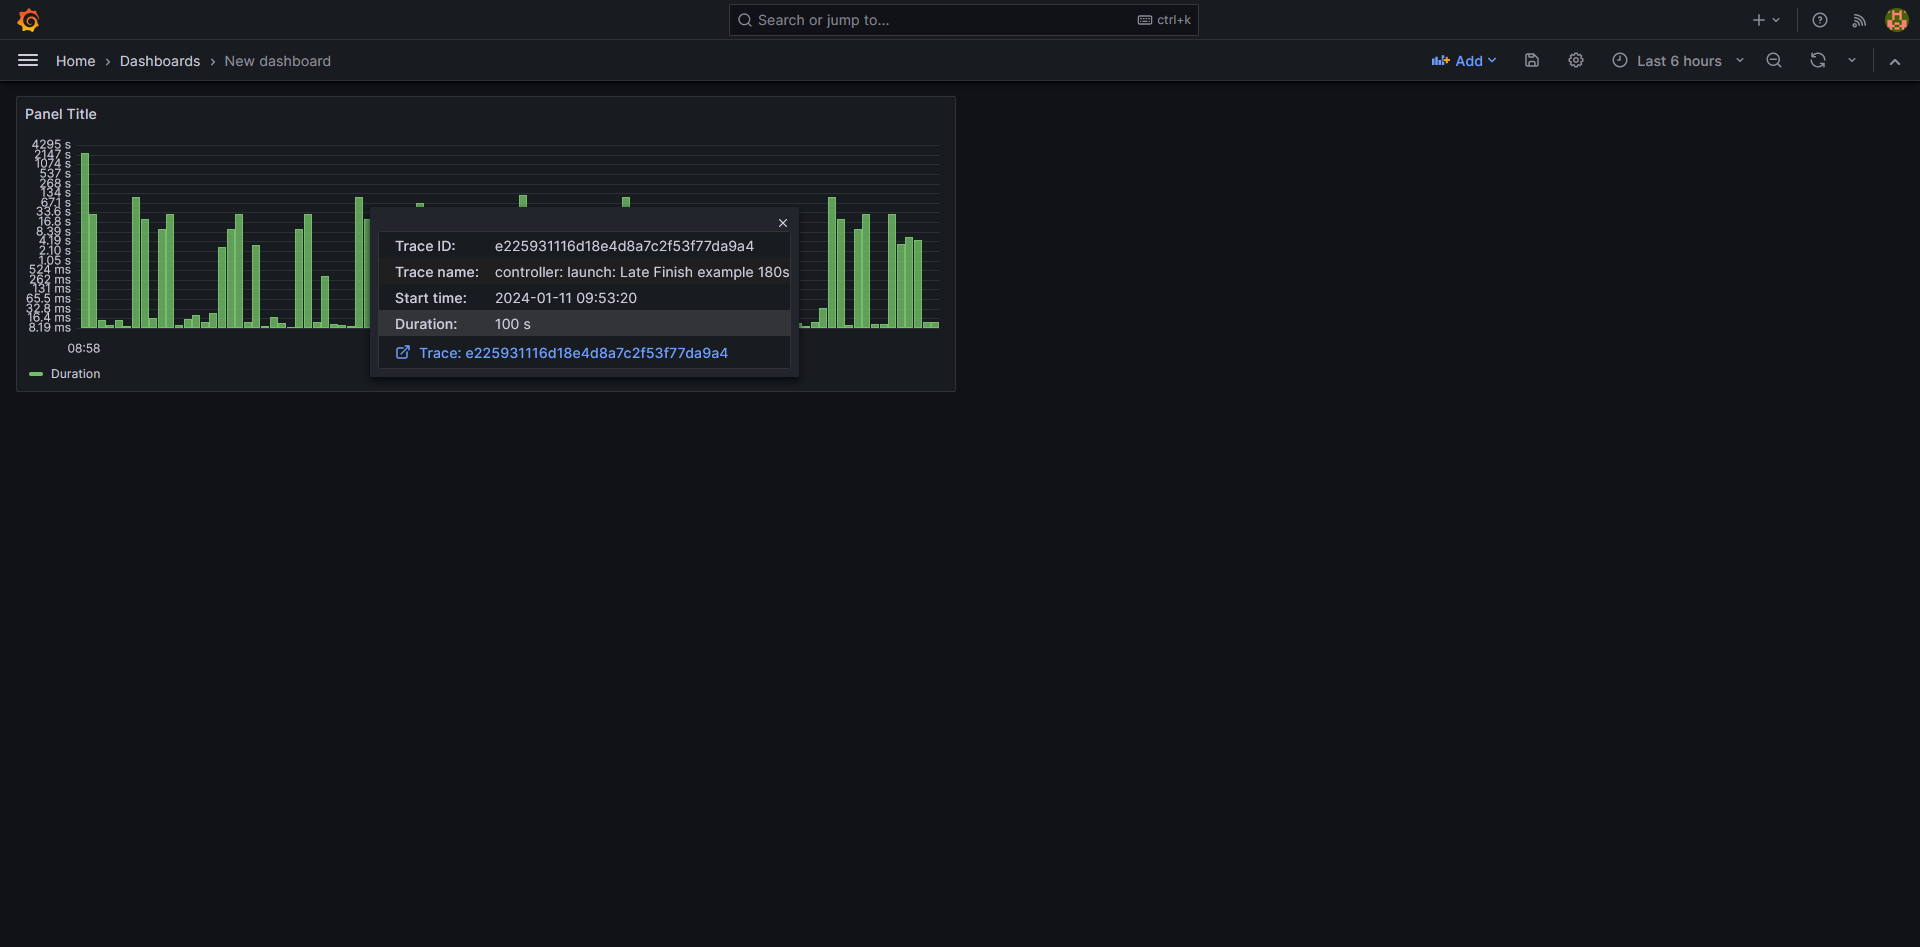
Bar Chart of incoming traces
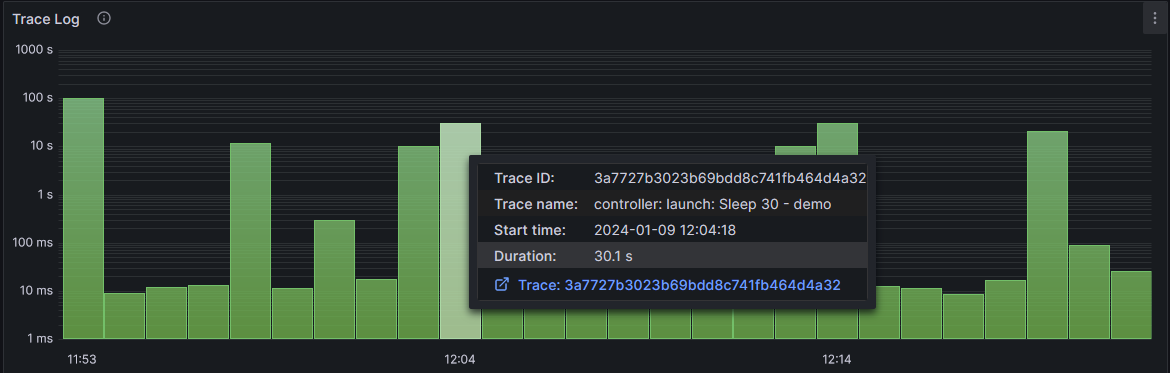
Description:
This Widget displays all the traces coming from the universal controller and displaying their duration. Hovering over a trace will give more information about the trace.
Configuration:
The bar chart is taking the “Jaeger” data source and accessing all the traces that come from the universal controller. The query is configured as follows:
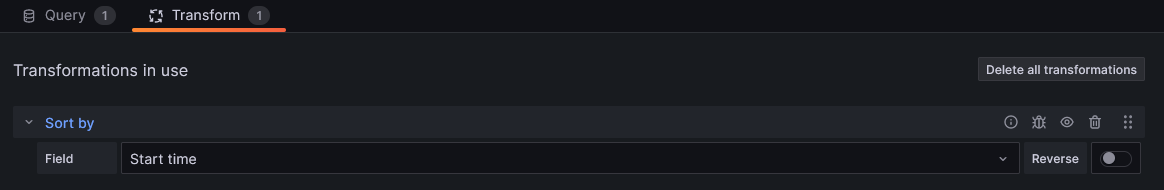
Once the query is set up. We need to add a transformation for the graph. Doing to the "transform" tab and choosing "sort by" and sorting by the start time will result in the trace links matching the correct traces.
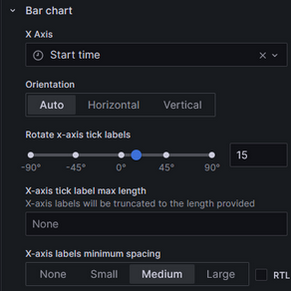
Going to the general settings tab and changing the X-Axis to the start time and setting the Y-axis to a log10 scale will allow for more visibility.
Changing the Tooltip to show all information allows the user to hover over a trace and inspect it more closely using grafana’s trace tools.
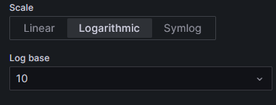
Clicking on the trace link will result in a new tab opening up for detailed views of the trace:
Example widget for universal extensions: Cloud Data Transfer
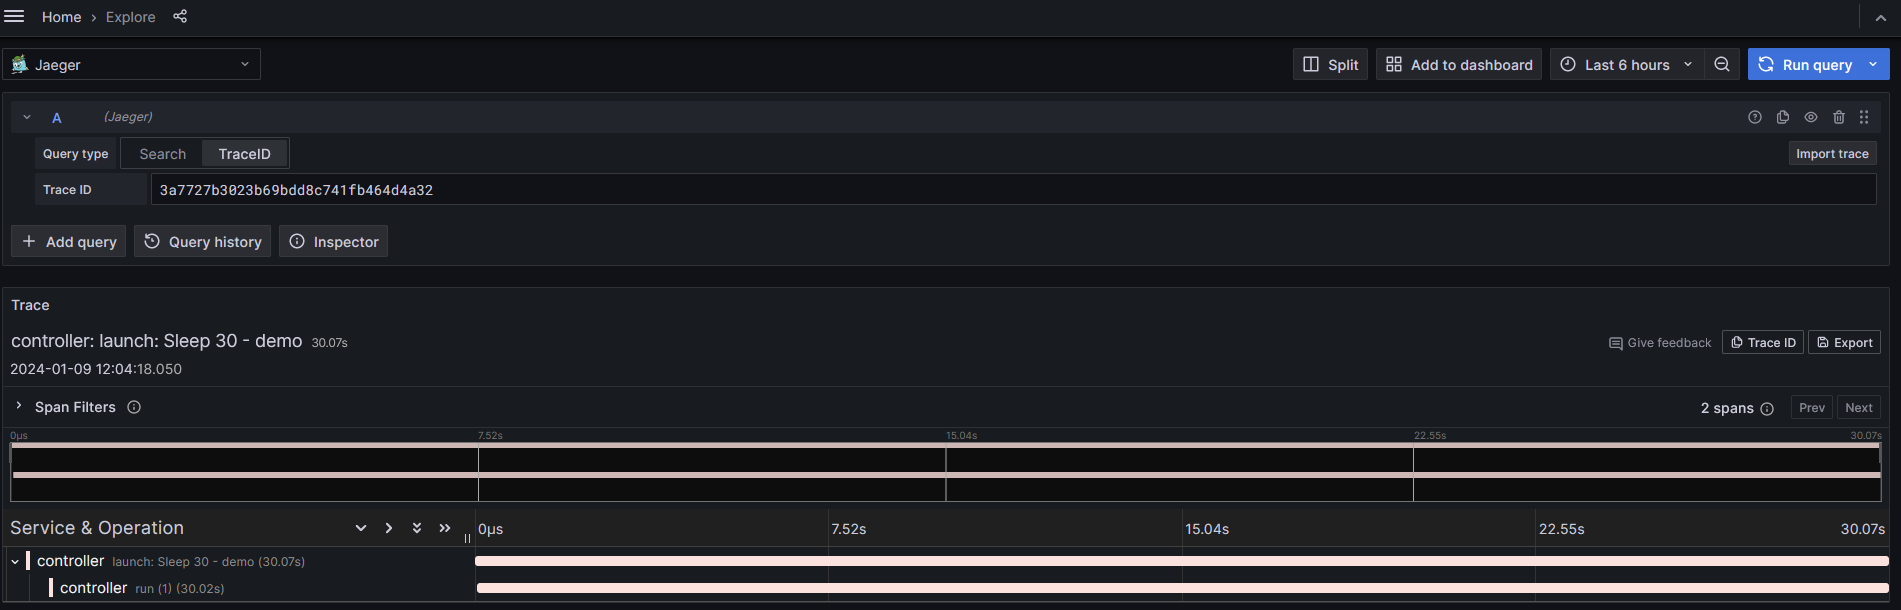
Max Avg. duration of file transfers
A stat graph showing the maximum average time for a Cloud Data Transfer task.
To configure the query we use the "sum by" and "increase" operators with 2 metrics that are divided by each other. For more clarity an override is added to change the color of the widget.
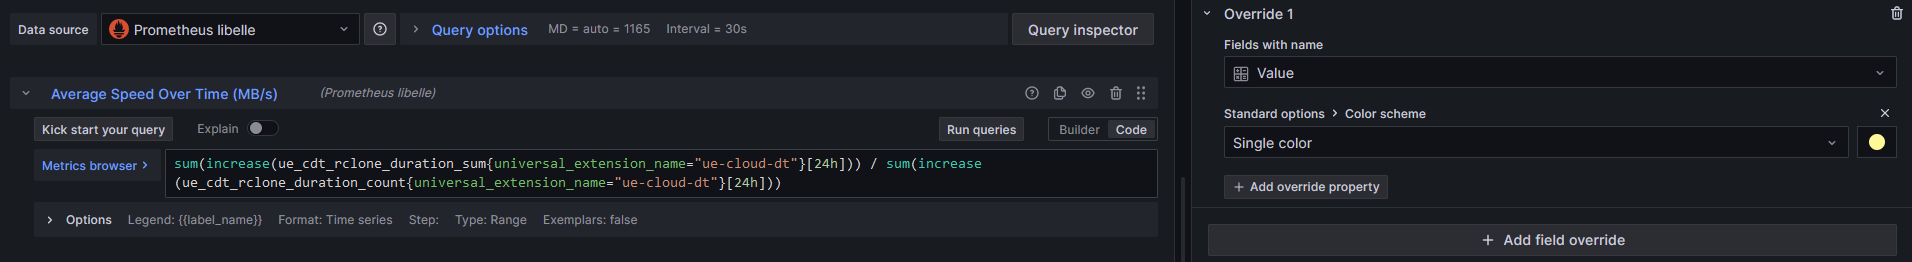
The code shown above is pasted here:
sum(increase(ue_cdt_rclone_duration_sum{universal_extension_name="ue-cloud-dt"}[24h])) / sum(increase(ue_cdt_rclone_duration_count{universal_extension_name="ue-cloud-dt"}[24h]))
The time interval can be changed to see determine the time period. This example was the max average in 24h.
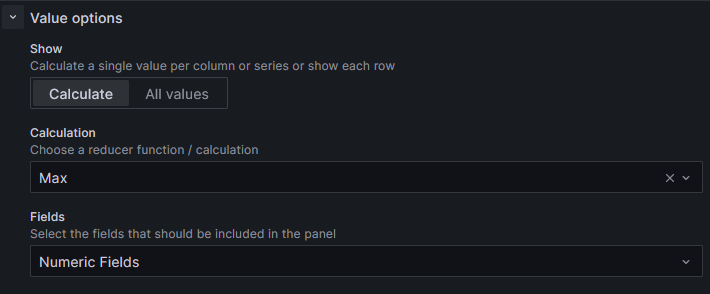
Important is that under the general settings the calculation is set to the max number. This allows the query to only give the maximum amount of the calculated average.
If the value on the stat graph is not shown in seconds it can help to set the units used to "seconds" this will force the stat graph to show the given value in seconds.
Demo Dashboard
The following section is dedicated to an example dashboard created for Observabilty use cases.

The dashboard is split into different parts. The dashboard has variables set for the current instance that should be watched, as well as the datasource currently used.
The Visulization setup is using nested dashboards and variables to ensure a better overview of the data injected. In the main dashboard information for the business services and Agents can be seen, as well as tasks/traces and logs.

Under the Traces/Tasks Row there are multiple Widgets showing the information about the tasks, for example the amount of Successful or Failed tasks or how long tasks run for.
There is also some Widgets using Grafana's machine learning tool in order to predict task usage in the future.
Using the nested dashboards feature more information for different Businessservices or Universal Agents can be viewed. The dashboard for the Businessservices looks as follows and is also featured in the Example Widgets section

The same can be done for inspecting the tasks associated with the Businessservice.

The results in better view of the different tasks and statuses without cluttering a single dashboard with endless rows.