Introduction
What is Observability?
In the ever-evolving landscape of distributed system operations, ensuring the reliability, performance, and scalability of complex applications has become increasingly more difficult. System Observability has emerged as a critical practice that empowers IT organizations to effectively monitor and gain deep insights into the inner workings of their software systems. By systematically collecting and analyzing data about applications, infrastructure, and user interactions, observability enables teams to proactively identify, diagnose, and resolve issues, ultimately leading to enhanced user experiences and operational efficiency.
What is OpenTelemetry?
OpenTelemetry is an open-source project that standardizes the collection of telemetry data from software systems, making it easier for organizations to gain holistic visibility into their environments. By seamlessly integrating with various programming languages, frameworks, and cloud platforms, OpenTelemetry simplifies the instrumentation of applications, allowing developers and operators to collect rich, actionable data about their systems' behavior. The adoption of OpenTelemetry by software vendors and Application Performance Monitoring (APM) tools represents a significant shift in the observability landscape. OpenTelemetry has gained substantial traction across the industry due to its open-source, vendor-neutral approach and its ability to standardize telemetry data collection.
Many software vendors have started incorporating OpenTelemetry into their frameworks and libraries. Major cloud service providers like AWS, Azure, and Google Cloud have also embraced OpenTelemetry. In addition, many APM tools have integrated OpenTelemetry into their offerings. This integration allows users of these APM solutions to easily collect and visualize telemetry data from their applications instrumented with OpenTelemetry. It enhances the compatibility and flexibility of APM tools, making them more versatile in heterogeneous technology stacks.
Solution Architecture (Component Description)
.png?version=1&modificationDate=1696277053199&cacheVersion=1&api=v2&width=420&height=250)
How to Get Started
Introduction
The following will provide a minimal setup to get started with Observability for Universal Automation Center.
This set-up is based on widely used Open Source tools.
This set-up is not intended for production use. To use the provided set-up in a production environment, further security configurations have to be applied.
This set-up allows collecting Metrics and Trace data from the Universal Automation Center. The collected Metrics data is stored in Prometheus for analysis in Grafana.
The collected Trace data is stored in Elasticsearch for analysis in Jaeger. The Jaeger UI is embed in the Universal Controller.
Jaeger, Prometheus and Grafana are selected for this Get Started Guide as examples. Any other data store or analysis tool could also be used.
Metrics
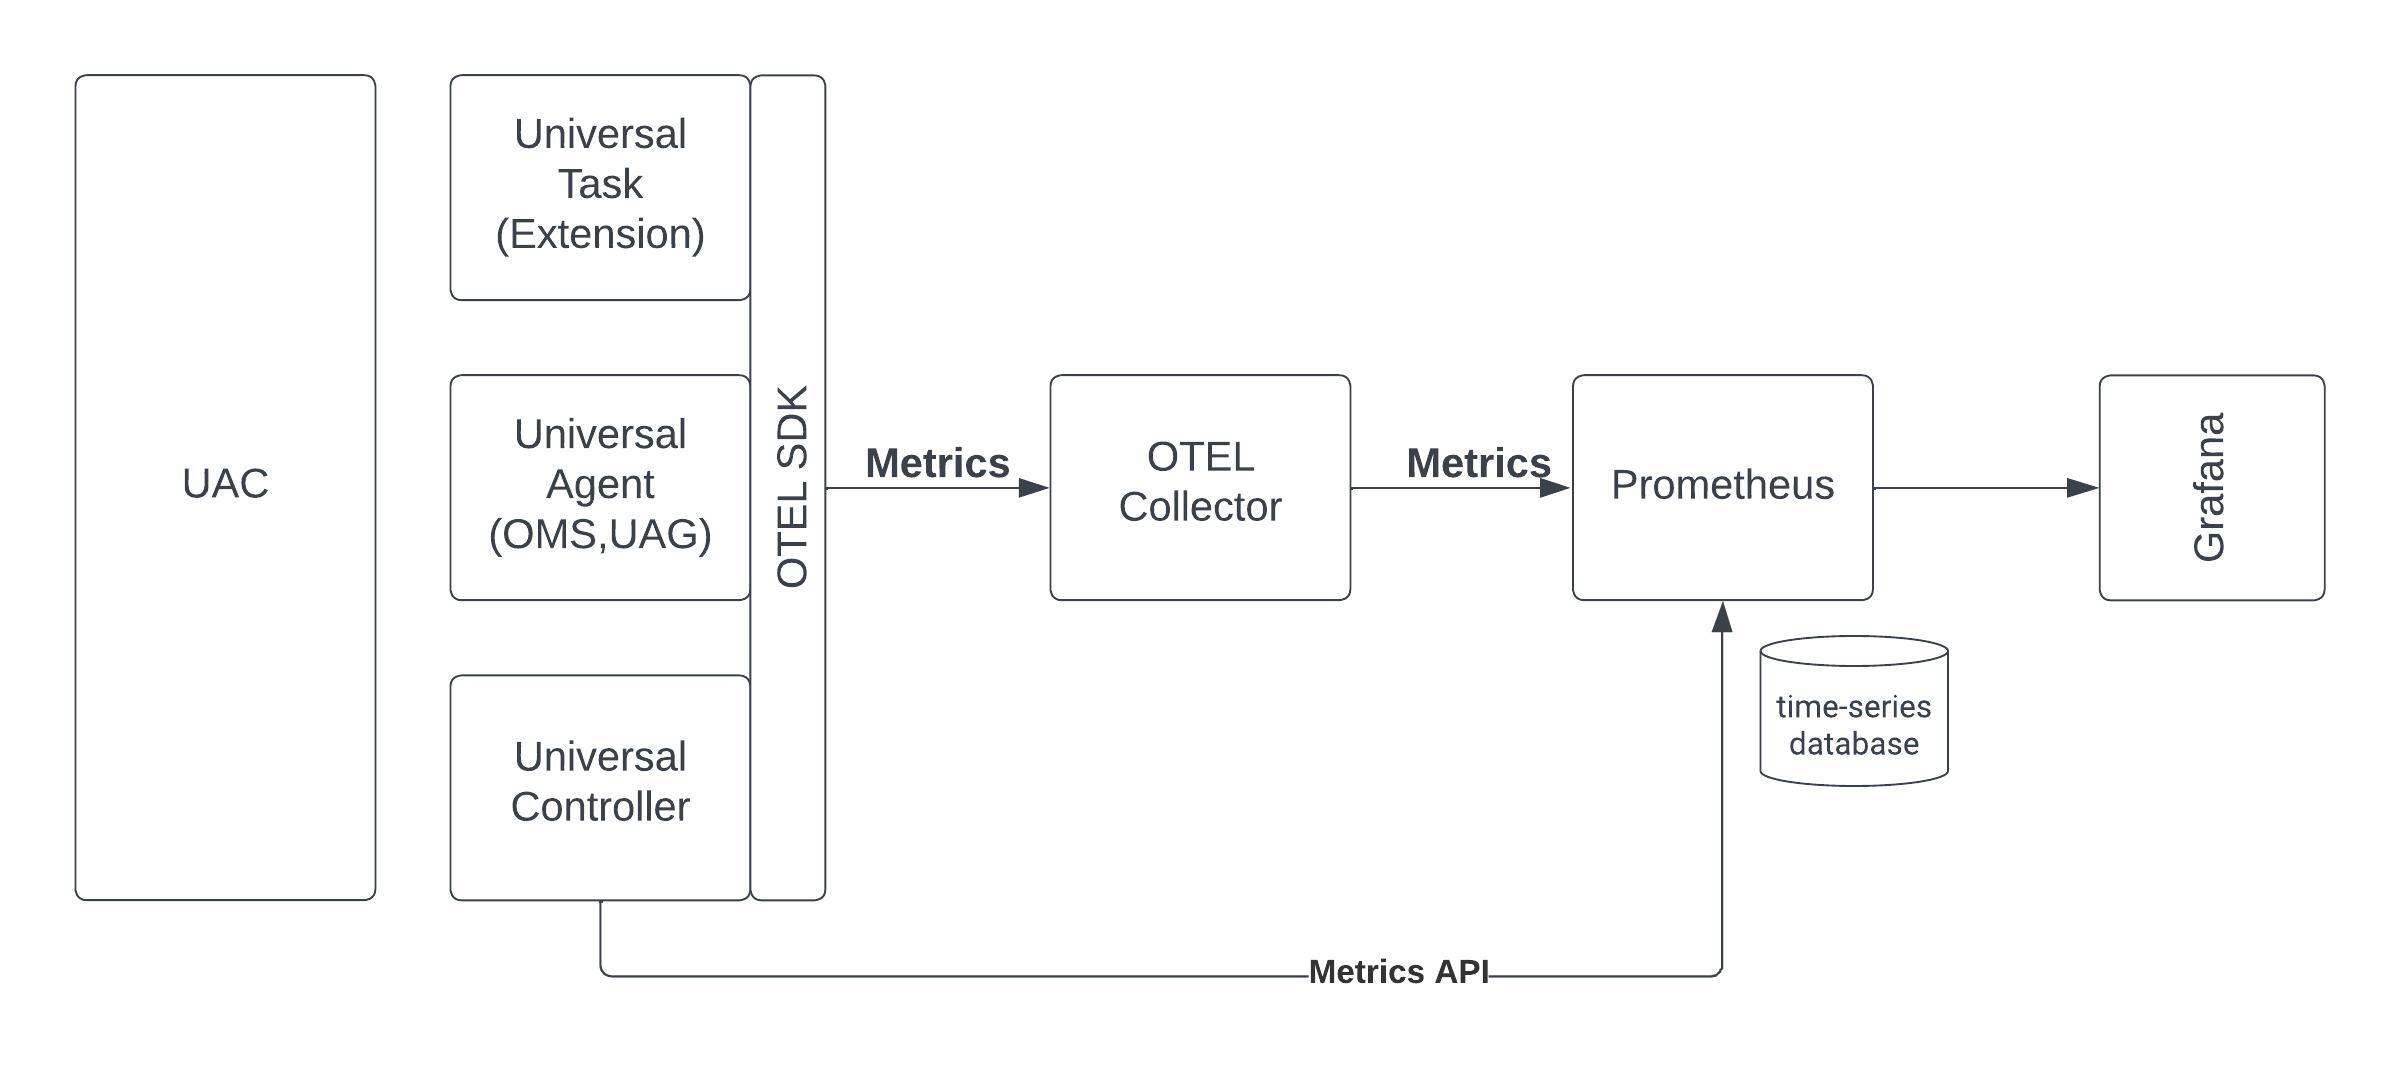
Metrics data can be collected from Universal Controller, Universal Agent, OMS and Universal Tasks of type Extension.
Metrics data is pulled through the Prometheus metrics Web Service endpoint (Metrics API) and via user-defined Universal Event Open Telemetry metrics, which is exported to an Open Telemetry metrics collector (OTEL Collector).
The collected Metrics data is exported to Prometheus for analysis in Grafana.
To enable Open Telemetry metrics, an Open Telemetry (OTEL) collector with a Prometheus exporter need to be configured.
Trace
Universal Controller will manually instrument Open Telemetry trace on Universal Controller (UC), OMS, Universal Agent (UA), and Universal Task Extension interactions associated with task instance executions, agent registration, and Universal Task of type Extension deployment.
The collected Trace data is stored in Elasticsearch for analysis in Jaeger.
To enable tracing an Open Telemetry span exporter must be configured.

Prerequisites
The sample set will be done on a single on-premise Linux server.
Server Requirements
- Linux Server
- Memory: 16GB RAM
- Storage: 70GB Net storage
- CPU: 4 CPU
- Distribution: Any major Linux distribution
- For the installation and configurations of the required Observability tools Administrative privileges are required
- Ports
The Following default ports will be used.
Application | Port |
|---|---|
| Prometheus | http: 9090 |
| Grafana: | http:3000 |
| Jaeger | http:16686 |
| Elastic | http:9200 |
| OTEL Collector | 4317 (grpc), 4318 (http) |
Pre-Installed Software Components
It is assumed that following components are installed and configured properly:
- Universal Agent 7.5.0.0 or higher
- Universal Controller 7.5.0.0 or higher
Please refer to the documentation for Installation and Applying Maintenance
and Universal Agent UNIX Quick Start Guide for further information on how to install Universal Agent and Universal Controller.
Required Software for the Observability
The following Opensource Software needs to be installed and configured for use with Universal Automation Center.
Note: This Startup Guide has been tested with the provide Software Version in the table below.
| Software | Version | Linux Archive |
|---|---|---|
| elasticsearch | 7.17.12 | https://artifacts.elastic.co/downloads/elasticsearch/elasticsearch-7.17.12-linux-x86_64.tar.gz |
otelcol-contrib | 0.86.0 | https://github.com/open-telemetry/opentelemetry-collector-releases/releases/download/v0.86.0/otelcol-contrib_0.86.0_linux_amd64.tar.gz |
jaeger all in one | 1.49.0 | https://github.com/jaegertracing/jaeger/releases/download/v1.49.0/jaeger-1.49.0-linux-amd64.tar.gz |
prometheus | 2.47.1 | https://github.com/prometheus/prometheus/releases/download/v2.47.1/prometheus-2.47.1.linux-amd64.tar.gz |
grafana-enterprise | 10.1.4 | https://dl.grafana.com/enterprise/release/grafana-enterprise-10.1.4.linux-amd64.tar.gz |
Configuration
Open Source Setup
It is important to follow the installation in the here given order, because the Software components have dependencies between each other.
Example:
- Jaeger needs Elasticsearch to store the trace data.
- OTEL Collector needs Prometheus to store the metrics data.
- Grafana needs Prometheus as data source for displaying the dashboards
Set up Elasticsearch
Description:
Elasticsearch is a distributed, RESTful search and analytics engine designed for real-time search and data storage. It is used for log and event data analysis, full-text search, and more.
In this set-up Elasticsearch is used as the storage backend for Jaeger.
Installation Steps:
Follow the official documentation to install Elasticsearch on your Linux Server.
Official Documentation: Elasticsearch Installation Guide
Install the Version listed in chapter Required Software for the Observability.
Configuration File:
- elasticsearch.yml: Main configuration file for Elasticsearch, containing cluster, node, network, memory, and other settings.
No adjustments to the default elasticsearch.yml file are required.
# ======================== Elasticsearch Configuration =========================
#
# NOTE: Elasticsearch comes with reasonable defaults for most settings.
#       Before you set out to tweak and tune the configuration, make sure you
#       understand what are you trying to accomplish and the consequences.
#
# The primary way of configuring a node is via this file. This template lists
# the most important settings you may want to configure for a production cluster.
#
# Please consult the documentation for further information on configuration options:
# https://www.elastic.co/guide/en/elasticsearch/reference/index.html
#
# ---------------------------------- Cluster -----------------------------------
#
# Use a descriptive name for your cluster:
#
#cluster.name: my-application
#
# ------------------------------------ Node ------------------------------------
#
# Use a descriptive name for the node:
#
#node.name: node-1
#
# Add custom attributes to the node:
#
#node.attr.rack: r1
#
# ----------------------------------- Paths ------------------------------------
#
# Path to directory where to store the data (separate multiple locations by comma):
#
#path.data: /path/to/data
#
# Path to log files:
#
#path.logs: /path/to/logs
#
# ----------------------------------- Memory -----------------------------------
#
# Lock the memory on startup:
#
#bootstrap.memory_lock: true
#
# Make sure that the heap size is set to about half the memory available
# on the system and that the owner of the process is allowed to use this
# limit.
#
# Elasticsearch performs poorly when the system is swapping the memory.
#
# ---------------------------------- Network -----------------------------------
#
# By default Elasticsearch is only accessible on localhost. Set a different
# address here to expose this node on the network:
#
#network.host: 192.168.0.1
#
# By default Elasticsearch listens for HTTP traffic on the first free port it
# finds starting at 9200. Set a specific HTTP port here:
#
#http.port: 9200
#
# For more information, consult the network module documentation.
#
# --------------------------------- Discovery ----------------------------------
#
# Pass an initial list of hosts to perform discovery when this node is started:
# The default list of hosts is ["127.0.0.1", "[::1]"]
#
#discovery.seed_hosts: ["host1", "host2"]
#
# Bootstrap the cluster using an initial set of master-eligible nodes:
#
#cluster.initial_master_nodes: ["node-1", "node-2"]
#
# For more information, consult the discovery and cluster formation module documentation.
#
# ---------------------------------- Various -----------------------------------
#
# Require explicit names when deleting indices:
#
#action.destructive_requires_name: true
#
# ---------------------------------- Security ----------------------------------
#
#                                 *** WARNING ***
#
# Elasticsearch security features are not enabled by default.
# These features are free, but require configuration changes to enable them.
# This means that users don’t have to provide credentials and can get full access
# to the cluster. Network connections are also not encrypted.
#
# To protect your data, we strongly encourage you to enable the Elasticsearch security features.
# Refer to the following documentation for instructions.
#
# https://www.elastic.co/guide/en/elasticsearch/reference/7.16/configuring-stack-security.html
Test the Installation:
# Check default Port:
ss -tuln | grep 9200

# Result:
tcp    LISTEN  0       128      [::ffff:127.0.0.1]:9200                 *:*

# Check Eleasticserach is running
curl -XGET "http://127.0.0.1:9200"

# Result:
{
  "name" : "wiesloch",
  "cluster_name" : "elasticsearch",
  "cluster_uuid" : "tFSoPN8lT1yS4_hEv6nzzQ",
  "version" : {
    "number" : "7.17.12",
    "build_flavor" : "default",
    "build_type" : "tar",
    "build_hash" : "e3b0c3d3c5c130e1dc6d567d6baef1c73eeb2059",
    "build_date" : "2023-07-20T05:33:33.690180787Z",
    "build_snapshot" : false,
    "lucene_version" : "8.11.1",
    "minimum_wire_compatibility_version" : "6.8.0",
    "minimum_index_compatibility_version" : "6.0.0-beta1"
  },
  "tagline" : "You Know, for Search"
}
Setup up Jaeger
Description:
Jaeger is an open-source distributed tracing system used for monitoring and troubleshooting microservices-based applications.
In this set-up Universal Controller will manually instrument Open Telemetry trace on Universal Controller (UC), OMS, Universal Agent (UA), and Universal Task Extension interactions associated with task instance executions, agent registration, and Universal Task of type Extension deployment.
The collected Trace data is stored in Elasticsearch for analysis in Jaeger.
Installation Steps:
Follow the official documentation to install Jaeger on your Linux Server.
Official Documentation: Jaeger documentation (jaegertracing.io)
Install the Version listed in chapter Required Software for the Observability.
For a quick local installation the Jaeger all-in-one executable can be used. It includes the Jaeger UI, jaeger-collector, jaeger-query, and jaeger-agent, with an in memory storage component.
Configuration:
When starting the jaeger-all-in-one application the following command-line argument need to be set:
--collector.otlp.grpc.host-port :14317: This is a command-line argument passed to the Jaeger all-in-one binary to configure the host and port for the gRPC OTLP ( OpenTelemetry Protocol) endpoint. It specifies that the gRPC OTLP endpoint should listen on port 14317.--collector.otlp.http.host-port :14318: This is another command-line argument that configures the host and port for the HTTP OTLP endpoint, specifying port 14318.
Example:
./jaeger-all-in-one --collector.otlp.grpc.host-port :14317 --collector.otlp.http.host-port :14318 ..
Test the Installation:
# Check default Port:
ss -tuln | grep 16686

# Result:
tcp    LISTEN  0       128                       *:16686                *:*
Test that the Jaeger GUI is accessible: http://<hostname>:16686/search
Setup OTEL Collector
Description:
OpenTelemetry Collector is a vendor-agnostic observability data collector that gathers traces, metrics, and other telemetry data from various sources and sends it to different backends for analysis.
In this set-up OpenTelemetry collects Metrics data from Universal Controller, Universal Agent, OMS and Universal Tasks of type Extension.
Installation Steps:
Follow the official documentation to install OpenTelemetry on your Linux Server.
Official Documentation: OpenTelemetry Collector Installation
Install the Version listed in chapter Required Software for the Observability.
Configuration Files:
- otel-collector-config.yaml, Primary configuration file, which specifies how the collector should receive, process, and export telemetry data.
Let's break down the key sections and settings in this configuration
- Receiver: For UAC the HTTP, GRPC receiver for the OpenTelemetry Collector needs to be configured. The HTTP port (4318) or GRPC port (4317) should match the ports configured in the 'omss.conf' and 'uags.conf' files.
- Exporters: The following Exporters are configured to send telemetry data to: logging, Prometheus, and Jaeger
- Pipelines: Two pipelines are configured:
- traces: otlp → batch → jaeger
- metrics: otlp → batch → prometheus
The following provides a sample otel-collector-config.yaml file.
Note: In the omss.conf and uags.conf file the port needs to be set to 4318. refer to Configuring OTLP Endpoint to configure the omss.conf and uags.conf port for OpenTelemetry.
# otel-collector-config.yaml
# the http port 4318 (default) or grpc port 4317 should be the same as in the omss.conf and uags.conf
receivers:
  otlp:
    protocols:
      http:
        #tls:
        #cert_file: ue-cert.crt
        #key_file: ue-cert.key
        #endpoint: 0.0.0.0:4318
      grpc:
        #endpoint: 0.0.0.0:4317
exporters:
  logging:
    verbosity: detailed
  prometheus:
    endpoint: 0.0.0.0:8881
      #tls:
      #ca_file: "/path/to/ca.pem"
      #cert_file: "/path/to/cert.pem"
      #key_file: "/path/to/key.pem"
      #namespace: UAgent
      #const_labels:
      #label1: value1
      #"another label": spaced value
      #send_timestamps: true
      #metric_expiration: 180m
      #enable_open_metrics: true
      #add_metric_suffixes: false
    resource_to_telemetry_conversion:
      enabled: true
  jaeger:
    endpoint: localhost:14250
    tls:
      insecure: true
processors:
  batch:
service:
  pipelines:
    traces:
      receivers: [otlp]
      processors: [batch]
      exporters: [jaeger]
    metrics:
      receivers: [otlp]
      processors: [batch]
      exporters: [prometheus]
Test the Installation:
# Test:
ps aux | grep otelcol-contrib

# Result:
stonebr+  25926  0.3  0.7 854136 119616 ?       Sl   12:55   0:14 ./otelcol-contrib --config=otel-collector-config.yaml
Set up Prometheus
Description:
Prometheus is an open-source monitoring and alerting toolkit designed for reliability and scalability. It collects metrics from monitored targets, stores them, and provides powerful querying and alerting capabilities.
In this set-up Prometheus is used to store the Metrics data retrieved via Opentelemetry and the Universal Controller Metrics REST API.
Installation Steps:
Follow the official documentation to install Prometheus on your Linux Server.
Official Documentation: Prometheus Installation Guide
Install the Version listed in chapter Required Software for the Observability.
Configuration Files:
- prometheus.yml: Main configuration file for Prometheus, defining scrape targets (what to monitor), alerting rules, and other settings.
In the prometheus.yaml configuration file for UAC the following scrape jobs are defined what metrics to collect and from where.
- OTelCollector' job, Prometheus collects metrics from the target
127.0.0.1:8881, which corresponds to the OpenTelemetry Collector's OTLP endpoint. - prometheus job, with the the
/metricsendpoint provides internal metrics related to the Prometheus server's performance and resource utilization. - controller job, Prometheus collects data via the Universal Controller Webservice Metrics API. Replace
'ops.admin'and'xxx'with the actual username and password required to access the metrics.
# my global config
global:
  scrape_interval: 15s # Set the scrape interval to every 15 seconds. Default is every 1 minute.
  evaluation_interval: 15s # Evaluate rules every 15 seconds. The default is every 1 minute.
  # scrape_timeout is set to the global default (10s).

# Alertmanager configuration
alerting:
  alertmanagers:
    - static_configs:
        - targets:
          # - alertmanager:9093

# Load rules once and periodically evaluate them according to the global 'evaluation_interval'.
rule_files:
  # - "first_rules.yml"
  # - "second_rules.yml"

# A scrape configuration containing exactly one endpoint to scrape:
# Here it's Prometheus itself.
scrape_configs:
  # The job name is added as a label `job=<job_name>` to any timeseries scraped from this config.

    # metrics_path defaults to '/metrics'
    # scheme defaults to 'http'.

  - job_name: 'OTelCollector'
    static_configs:
      - targets: ["127.0.0.1:8881"]
        #- job_name: "OTelCollector"
        #static_configs:
        #- targets: ["127.0.0.1:8888"]

  - job_name: 'prometheus'
    metrics_path: /metrics
    static_configs:
    - targets:
      - localhost:9090

  - job_name: 'controller'
    basic_auth:
       username: 'ops.admin'
       password: 'canton123'
    metrics_path: '/uc/resources/metrics'  # The correct path where the metrics are exposed by the web service. Note for cloud controller: '/resources/metrics'
    static_configs:
      - targets:
              - 'localhost:8080'  # Use the correct hostname or IP address and port of your web service.
Test the Installation:
# Check default Port:
ss -tuln | grep 9090

# Result:
tcp    LISTEN  0       128                       *:9090                 *:*
Test that the prometheus GUI is accessibly: http://<hostname>:9090
Set up Grafana
Description:
Grafana is an open-source platform for monitoring and observability that allows you to create, explore, and share dynamic dashboards and visualizations for various data sources, including time series databases.
In the this set-up Grafana is used to Visualize and Analyze the Metrics data store in Prometheus data source (time series database).
Installation Steps:
Follow the official documentation to install Grafana on your Linux Server.
Install the Version listed in chapter Required Software for the Observability.
Configuration Files:
- grafana.ini: Grafana's main configuration file, including database connections, server settings, and global configurations.
- datasources.yaml: Configuration for data sources (e.g., Prometheus) that Grafana connects to.
- dashboards: Grafana dashboards are often defined as JSON files that can be imported into Grafana.
Official Documentation: Grafana Installation Guide
Test the Installation:
http://<hostname>:3000/
Universal Controller
Description:
Universal Controller
Installation Steps:
Update Universal Controller Properties
The following uc.properties need to be set in order to enable metrics and traces from Universal Controller:
| Name | Description |
|---|---|
| uc.otel.exporter.otlp.metrics.endpoint | The OTLP metrics endpoint to connect to. Must be a URL with a scheme of either http or https based on the use of TLS. Default is http://localhost:4317 when protocol is grpc, and http://localhost:4318/v1/metrics when protocol is http/protobuf. |
| uc.otel.exporter.otlp.traces.endpoint | The OTLP traces endpoint to connect to. Must be a URL with a scheme of either http or https based on the use of TLS. Default is http://localhost:4317 when protocol is grpc, and http://localhost:4318/v1/traces when protocol is http/protobuf |
Please refer to the uc.properties documentation for a list of all configuration options.
Sample Configuration Files
The following provides a minimum uc.properties file:
uc.properties

# Enable metrics and trace from UC Controller

# The OTLP traces endpoint to connect to (grpc):
uc.otel.exporter.otlp.traces.endpoint http://localhost:4317

# The OTLP metrics endpoint to connect to (grpc):
uc.otel.exporter.otlp.metrics.endpoint http://localhost:4317
Update Universal Controller GUI
# in UC GUI properties
- open telemetry visualization URL: http://<hostname>:16686/trace/${traceId}?uiFind=${spanId}&uiEmbed=v0
- open telemetry visualization Iframe : True
Official Documentation: link to uc.properties open telemetry properties.
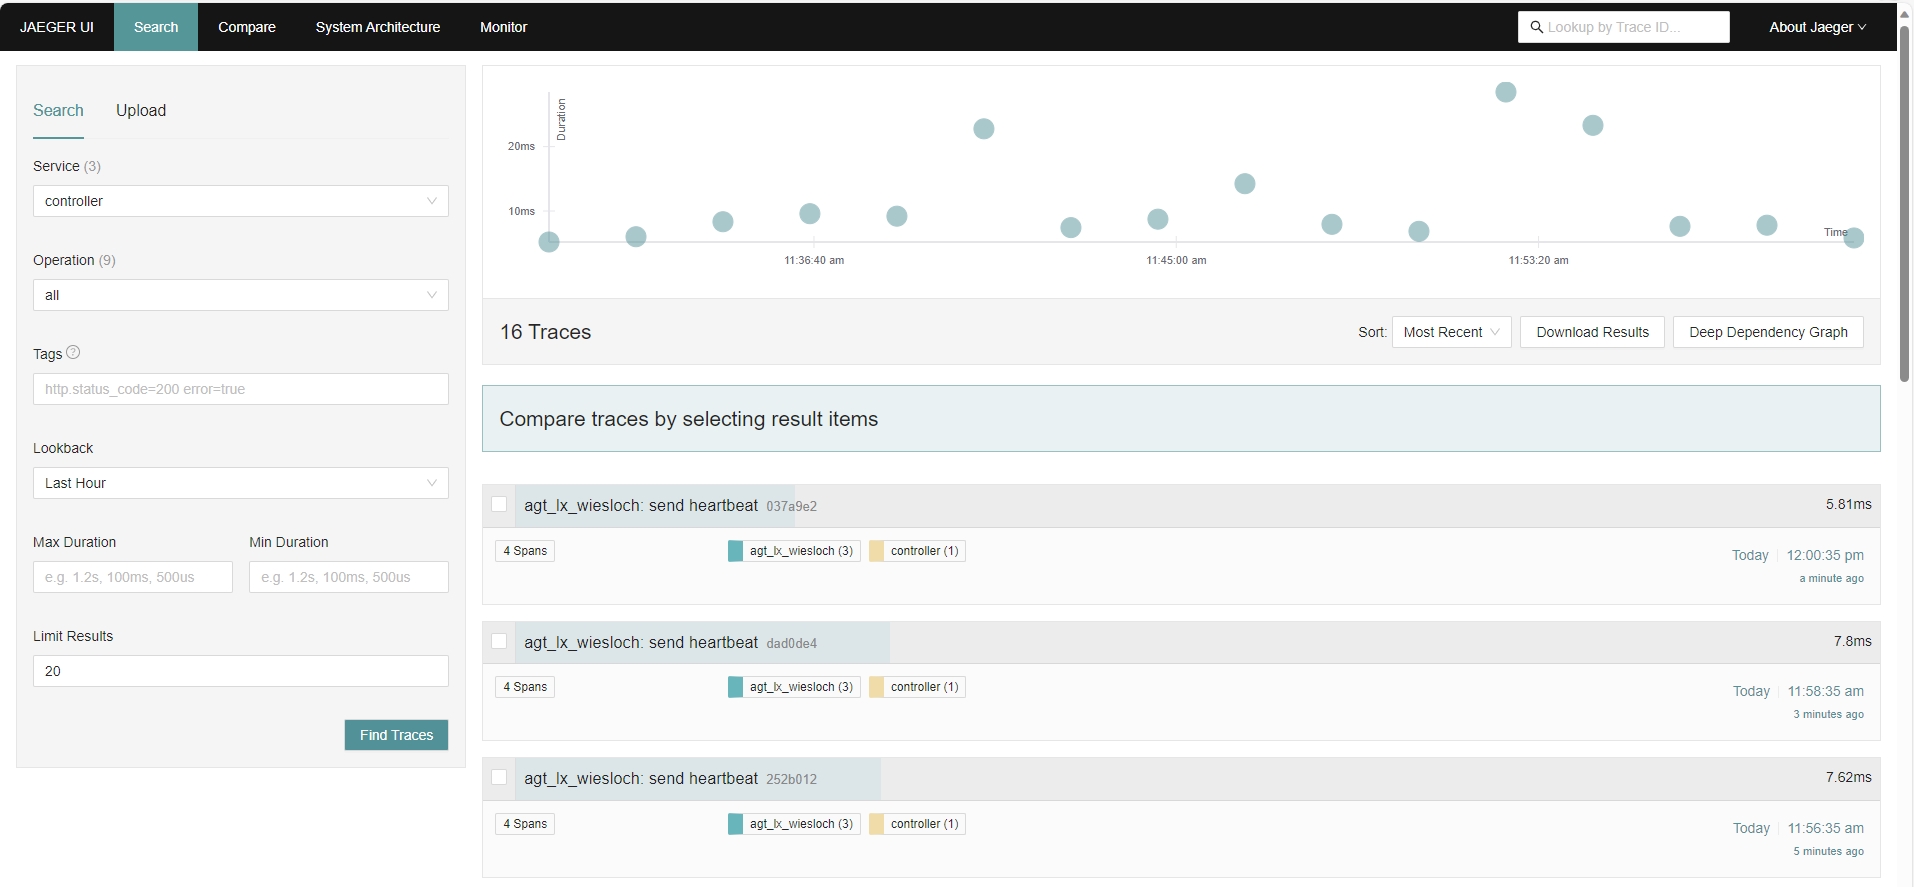
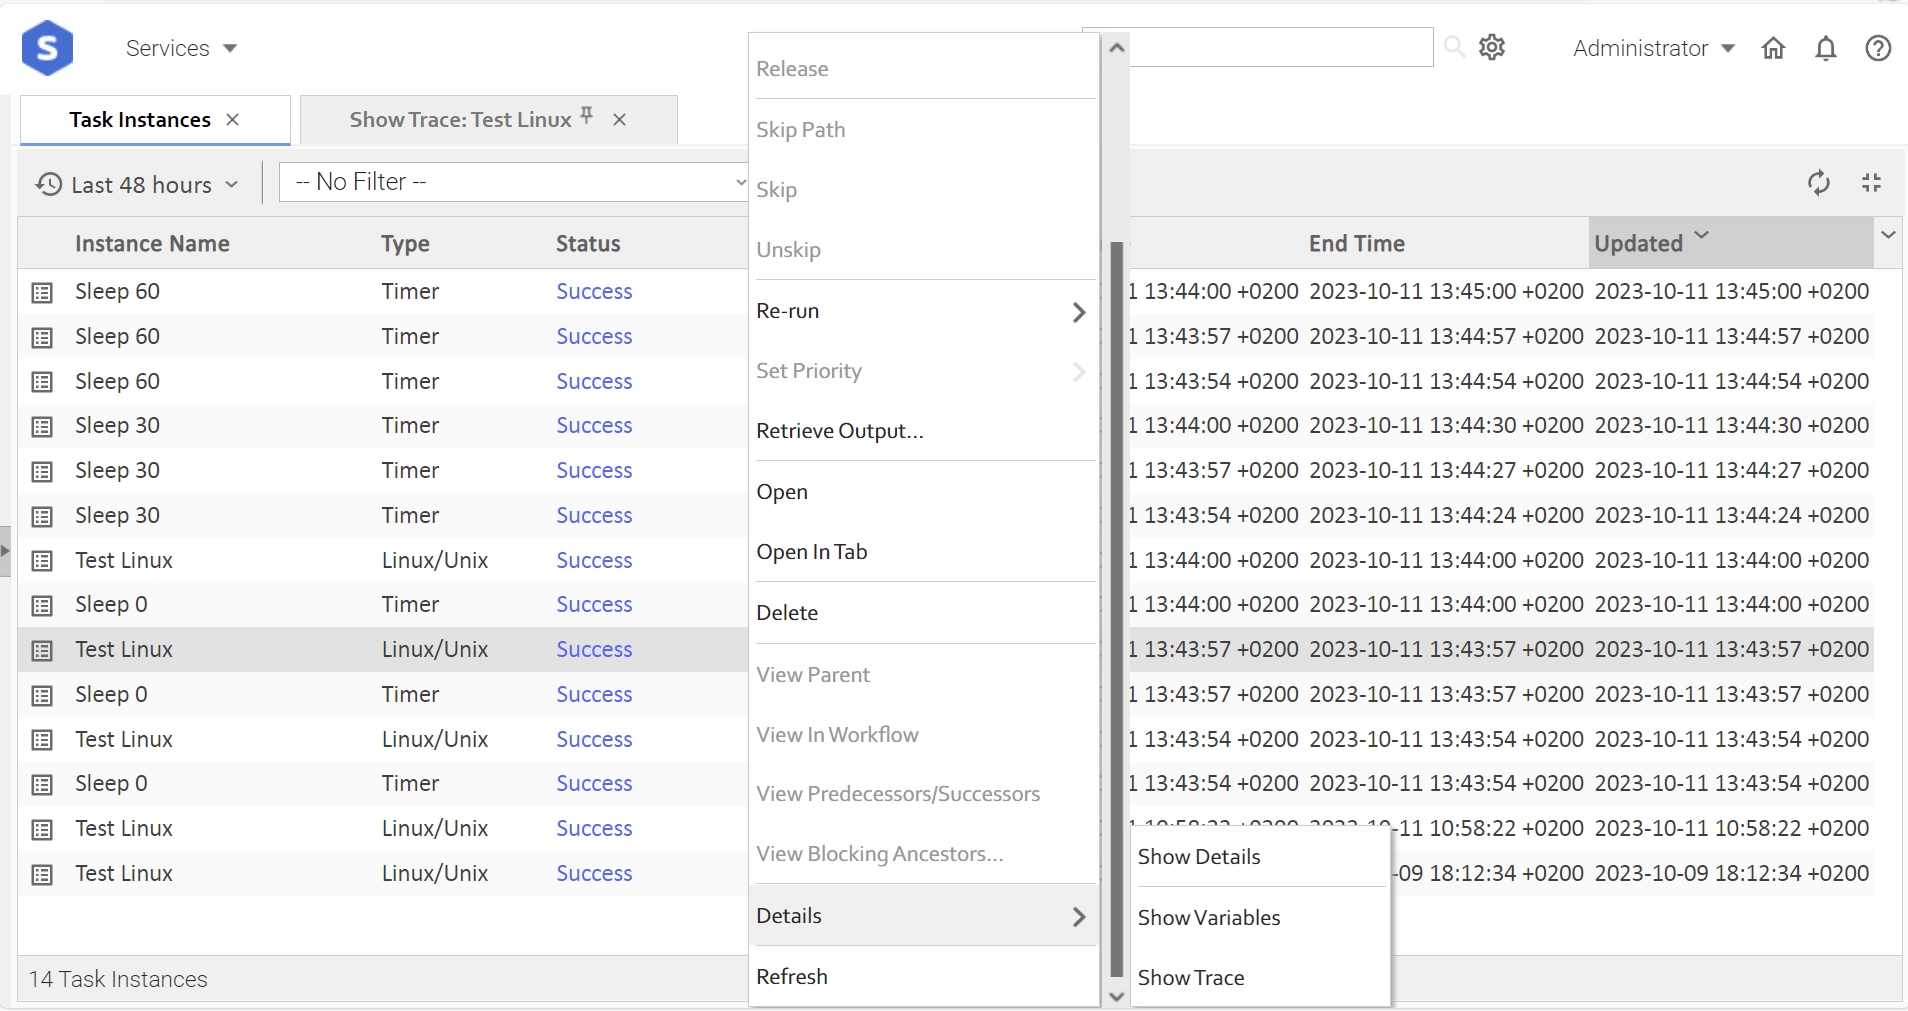
Test Universal Controller GUI with Jaeger embedded
Select the Details of Task Instance → Show Trace.
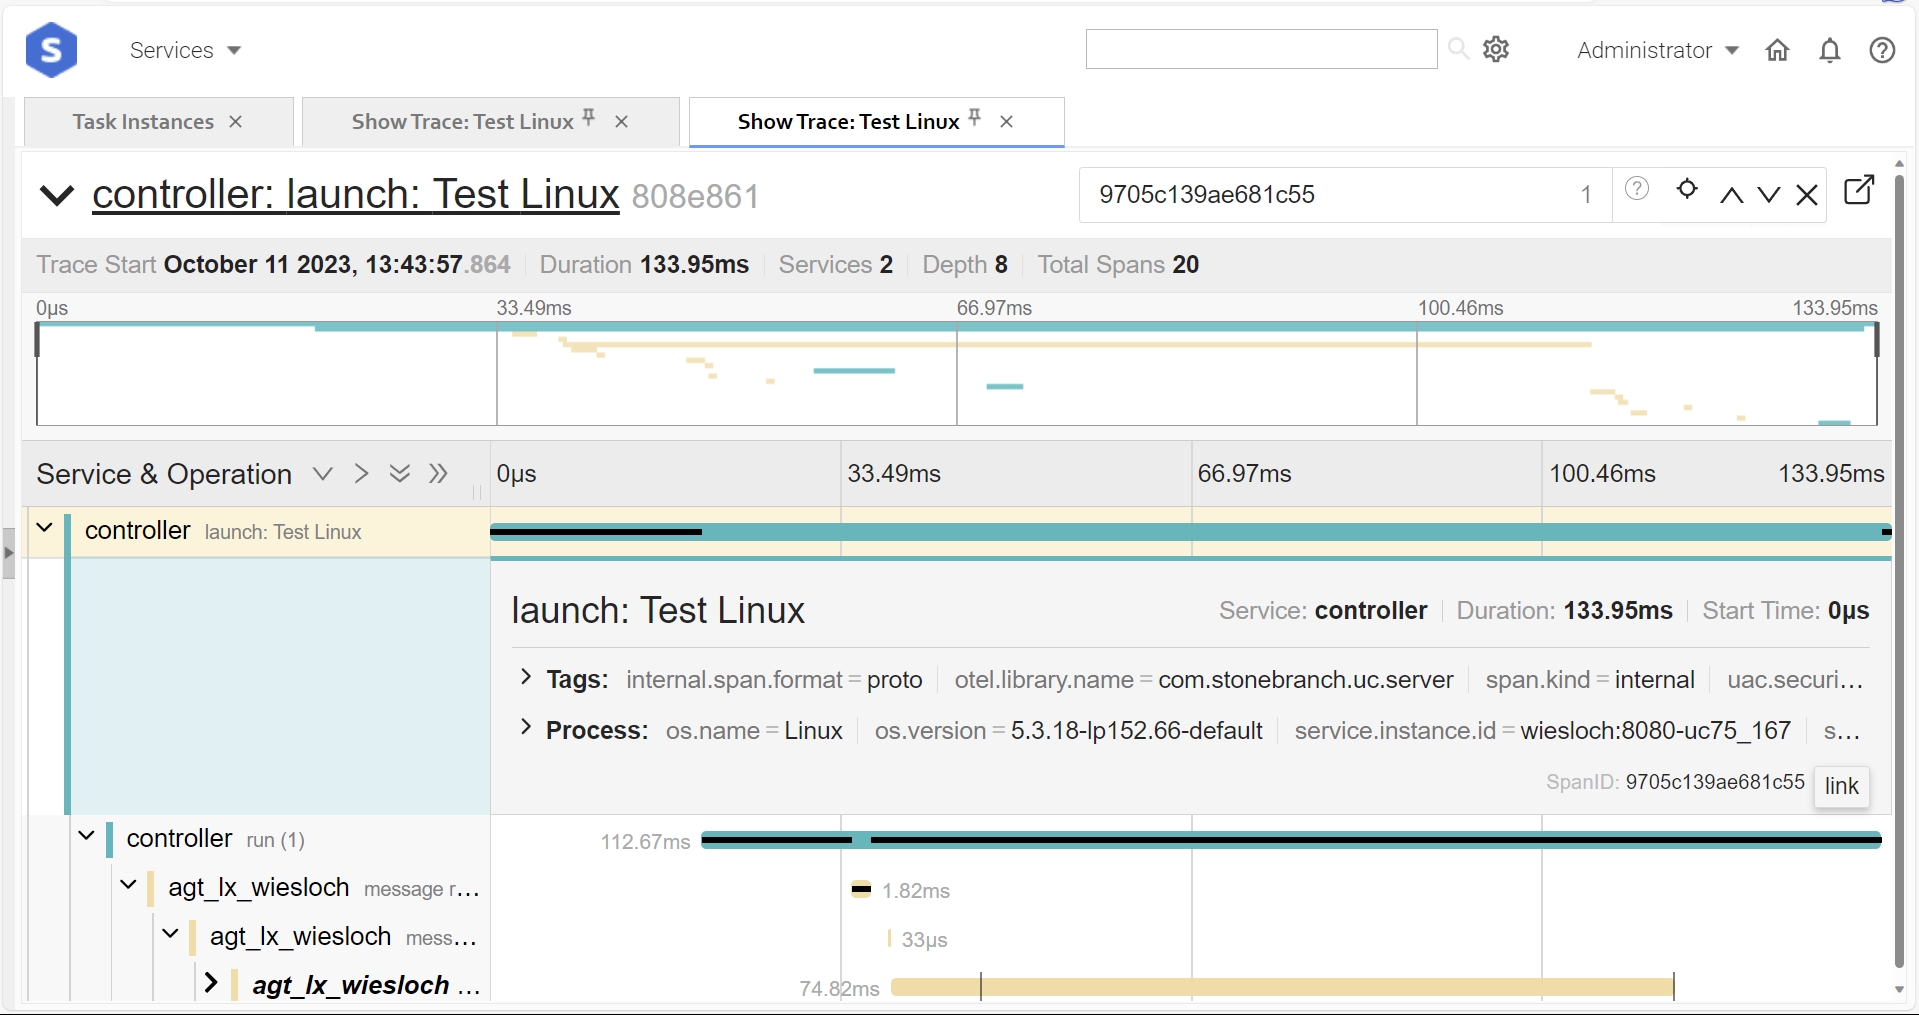
The embedded Jaeger UI should be displayed.
Jaeger UI embedded in Universal Controller GUI:
Universal Agent
Description:
The following describes the steps to enable tracing and metrics for UAG and OMS Server.
The here described set-up use http protocol. In addition to supporting HTTP (default), HTTPS is also supported.
Refer to the documentation on how to Enable and Configure SSL/TLS for OMS Server and UAG:
Installation Steps:
Enabling Metrics/Traces
Metrics and Traces will be turned off, by default, in both UAG and OMS Server. The user must configure two new options to enable metrics and traces.
Metrics:
| Component | Configuration File Option |
|---|---|
| UAG | otel_export_metrics YES |
| OMS Server | otel_export_metrics YES |
Traces:
| Component | Configuration File Option |
|---|---|
| UAG | otel_enable_tracing YES |
| OMS Server | otel_enable_tracing YES |
Configure Service Name
All applications using Opentelemetry must register a service.name, including UAG and OMS Server
| Component | Configuration File Option |
|---|---|
| UAG | otel_service_name <agent_name> |
| OMS Server | otel_service_name <oms_agent_name> |
Configuring OTLP Endpoint
Both the metrics and tracing engines end up pushing the relevant data to the Opentelemetry collector using the HTTP(S) protocol (gRPC protocol
NOT supported this release). In most scenarios, the traces and metrics will be sent to the same collector, but this is not strictly necessary. To
account for this, two new options will be added in both UAG and OMS
Metrics:
| Component | Configuration File Option |
|---|---|
| UAG | otel_metrics_endpoint http://localhost:4318 |
| OMS Server | otel_metrics_endpoint http://localhost:4318 |
Traces:
| Component | Configuration File Option |
|---|---|
| UAG | otel_trace_endpoint http://localhost:4318 |
| OMS Server | otel_trace_endpoint http://localhost:4318 |
Configure how often to export the metrics from UAG and OMS Server
| Component | Configuration File Option |
|---|---|
| UAG | otel_metrics_export_interval 60 |
| OMS Server | otel_metrics_export_interval 60 |
The value:
Opentelemetry default of 60 seconds
is specified in seconds
must be non-negative (i.e. >0)
cannot exceed 2147483647
Sample Configuration Files
The following provides the sample set-up for UAG and OMS Server.
The otel_metrics_export_interval is not set. The default value of 60s is taken in that case.
# /etc/universal/uags.conf:

otel_export_metrics YES
otel_enable_tracing YES
otel_service_name agt_lx_wiesloch_uag
otel_metrics_endpoint http://localhost:4318
otel_trace_endpoint http://localhost:4318
# /etc/universal/omss.conf:

otel_export_metrics YES
otel_enable_tracing YES
otel_service_name agt_lx_wiesloch
otel_metrics_endpoint http://localhost:4318
otel_trace_endpoint http://localhost:4318
Note: After adjusting uags.conf and omss.conf restart the Universal Agent.
sudo /opt/universal/ubroker/ubrokerd restart
Official Documentation: Links to OMS and UAG open telemetry configuration options.
Beginner's Guide to Universal Automation Center Observability
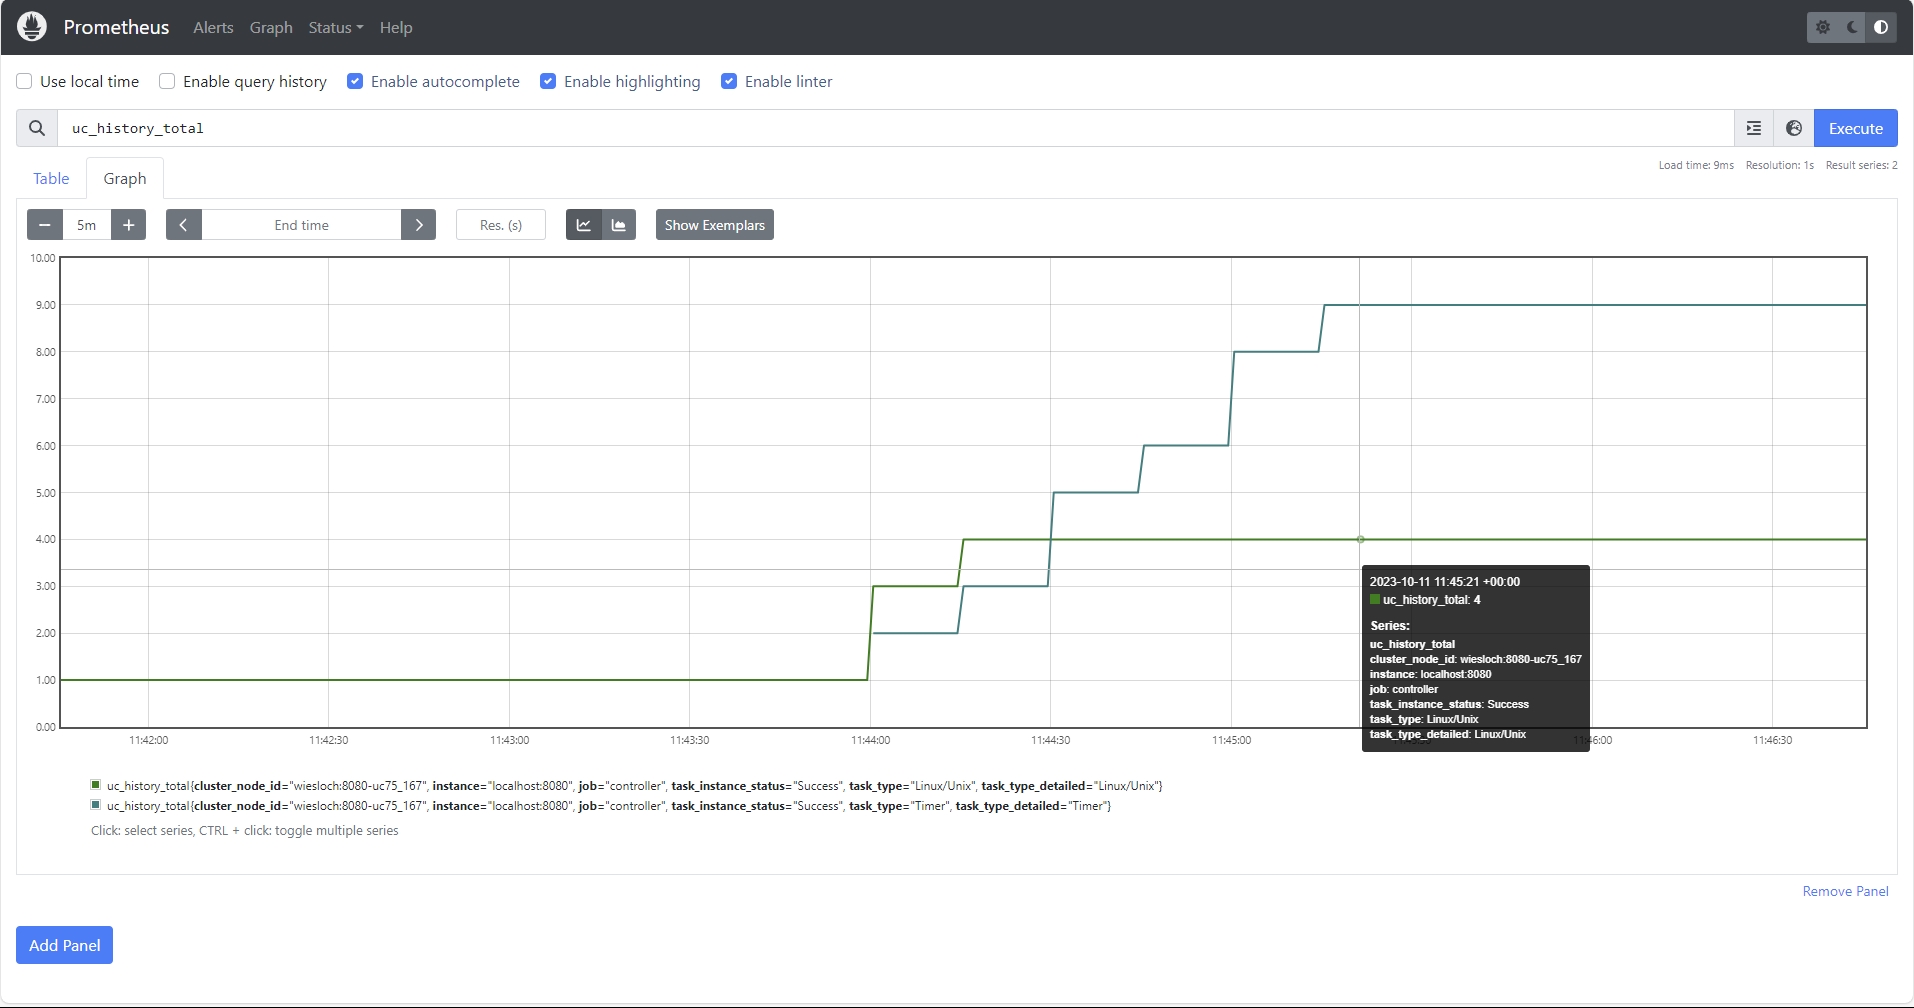
Tutorial: Metrics Data Collection and Analysis using Grafana
This tutorial will explain how to collect Metrics Data from the differed UAC components and display the collected data in a Grafana Dashboard using Prometheus as Datasource.
Metrics data can be collected from Universal Controller, Universal Agent, OMS and Universal Tasks of type Extension.
Metrics data is pulled through the Prometheus metrics Web Service endpoint (Metrics API) and via user-defined Universal Event Open Telemetry metrics, which is exported to an Open Telemetry metrics collector (OTEL Collector).
The collected Metrics data is exported to Prometheus for analysis in Grafana.
To enable Open Telemetry metrics, an Open Telemetry (OTEL) collector with a Prometheus exporter will be configured in this tutorial.
Installation
Prerequisites
The sample set will be done on a single on-premise Linux server.
Server Requirements
- Linux Server
- Memory: 16GB RAM
- Storage: 70GB Net storage
- CPU: 4 CPU
- Distribution: Any major Linux distribution
- For the installation and configurations of the required Observability tools, Administrative privileges are required
- Ports
The Following default ports will be used.
Application | Port |
|---|---|
| Prometheus | http:9090 |
| Grafana | http:3000 |
| OTEL Collector | 4317 (grpc), 4318 (http) |
Pre-Installed Software Components
The following components must be installed and configured properly:
- Universal Agent 7.5.0.0 or higher
- Universal Controller 7.5.0.0 or higher
Please refer to the documentation for Installation and Applying Maintenance
and Universal Agent UNIX Quick Start Guide for further information on how to install Universal Agent and Universal Controller.
Required Software for the Observability - Metrics
For this tutorial the following Opensource Software needs to be installed and configured for use with Universal Automation Center.
This Tutorial has been tested with the provided Software Versions in the table below.
| Software | Version | Linux Archive |
|---|---|---|
otelcol-contrib | 0.82.0 | https://github.com/open-telemetry/opentelemetry-collector-releases/releases/download/v0.82.0/otelcol-contrib_0.82.0_linux_amd64.tar.gz |
prometheus | 2.47.1 | https://github.com/prometheus/prometheus/releases/download/v2.47.1/prometheus-2.47.1.linux-amd64.tar.gz |
grafana-enterprise | 10.1.4 | https://dl.grafana.com/enterprise/release/grafana-enterprise-10.1.4.linux-amd64.tar.gz |
Installation Steps
- Install Prometheus
- Install OpenTelemetry Collector
- Install Grafana
- Configure Universal Agents to send metrics to open-telemetry
- Update Universal Controller (uc.properties) to send metrics to open-telemetry
- Configure a sample Dashboard in grafana ( add prometheus datasource, create visualization )
- Optionally configure grafana for TLS
In this tutorial, the required applications Prometheus, OpenTelemetry Collector and Grafana will be installed to the home directory of a Linux user with sudo permissions.
Replace the sample Server IP (192.168.88.17) and Name (wiesloch) with your Server IP and Hostname.
1. Install Prometheus
Prometheus will be configured to store Metrics from OTelCollector and Universal Controller
Download prometheus to your home directory and unpack it
cd ~
curl -LJO https://github.com/prometheus/prometheus/releases/download/v2.47.1/prometheus-2.47.1.linux-amd64.tar.gz
tar -xvzf prometheus-2.47.1.linux-amd64.tar.gz --directory ~
Create Softlink
ln -sf prometheus-2.47.1.linux-amd64 prometheus
Adjust config file: prometheus.yml
# Adjustments:
# Adjust the Controller username and password
# Adjust the Controller targets and metrics_path
# Local Controller:
# - metrics_path: '/uc/resources/metrics'
# - target: 'wiesloch:8080'
# Cloud Controller:
# - metrics_path: '/resources/metrics'
# - target: 'uc.companya.cloud'

vi ~/prometheus/prometheus.yml

# my global config
global:
scrape_interval: 15s # Set the scrape interval to every 15 seconds. Default is every 1 minute.
evaluation_interval: 15s # Evaluate rules every 15 seconds. The default is every 1 minute.
# scrape_timeout is set to the global default (10s).

# Alertmanager configuration
alerting:
alertmanagers:
- static_configs:
- targets:
# - alertmanager:9093

# Load rules once and periodically evaluate them according to the global 'evaluation_interval'.
rule_files:
# - "first_rules.yml"
# - "second_rules.yml"

# A scrape configuration containing exactly one endpoint to scrape:
# Here it's Prometheus itself.
scrape_configs:
# The job name is added as a label `job=<job_name>` to any timeseries scraped from this config.

# metrics_path defaults to '/metrics'
# scheme defaults to 'http'.

- job_name: 'OTelCollector'
static_configs:
- targets: ["127.0.0.1:8881"]
#- job_name: "OTelCollector"
#static_configs:
#- targets: ["127.0.0.1:8888"]

- job_name: 'prometheus'
metrics_path: /metrics
static_configs:
- targets:
- localhost:9090

- job_name: 'controller'
basic_auth:
username: 'ops.admin'
password: 'xxxx'
metrics_path: '/uc/resources/metrics' # The correct path where the metrics are exposed by the web service.
static_configs:
- targets:
- 'wiesloch:8080' # Use the correct hostname or IP address and port of your web service.
Create Start Script
vi ~/start_prometheus.sh

#! /bin/bash

timestamp=$(date +%Y%m%d%H%M%S)
cd ~/prometheus
nohup ./prometheus --config.file=prometheus.yml --log.level=debug 0</dev/null >prometheus_$timestamp.out 2>prometheus_$timestamp.err &
sleep 3
echo "Started $(pidof prometheus)"
Create Stop Script
vi ~/stop_prometheus.sh

#! /bin/bash

pid=$(pidof prometheus)
if [ -n "$pid" ]; then
    kill $pid
    echo "Stopped $pid"
else
    echo "No pid found"
fi
Start/Stop Prometheus
cd ~
./start_prometheus.sh
./stop_prometheus.sh
Checks
Log Files:
~/prometheus/prometheus_<YYYYMMDDHHMMSS>.err
~/prometheus/prometheus_<YYYYMMDDHHMMSS>.out
URL:
http://wiesloch:9090
Port:
sudo netstat -tuln | grep 9090
Process:
ps aux | grep prometheus
2. Install OpenTelemetry Collector
opentelemetry-collector will be configured to export metrics to Prometheus
Download opentelemetry-collector to your home directory and unpack it
cd ~
curl -LJO https://github.com/open-telemetry/opentelemetry-collector-releases/releases/download/v0.82.0/otelcol-contrib_0.82.0_linux_amd64.tar.gz
mkdir ~/otelcol
tar -xvzf otelcol-contrib_0.82.0_linux_amd64.tar.gz --directory ~/otelcol
Adjust config file: otel-collector-config.yaml
# verify that the http port 4318 (default) is the same then in the omss.conf and uags.conf

vi ~/otelcol/otel-collector-config.yaml

receivers:
  otlp:
    protocols:
      http:
        #tls:
        #cert_file: ue-cert.crt
        #key_file: ue-cert.key
        #endpoint: 0.0.0.0:4318
      grpc:
        #endpoint: 0.0.0.0:4317
exporters:
  logging:
    verbosity: detailed
  prometheus:
    endpoint: 0.0.0.0:8881
      #tls:
      #ca_file: "/path/to/ca.pem"
      #cert_file: "/path/to/cert.pem"
      #key_file: "/path/to/key.pem"
      #namespace: UAgent
      #const_labels:
      #label1: value1
      #"another label": spaced value
      #send_timestamps: true
      #metric_expiration: 180m
      #enable_open_metrics: true
      #add_metric_suffixes: false
    resource_to_telemetry_conversion:
      enabled: true
processors:
  batch:
service:
  pipelines:
    metrics:
      receivers: [otlp]
      processors: [batch]
      exporters: [prometheus]
Create Start Script
vi ~/stop_otelcol.sh

#! /bin/bash

timestamp=$(date +%Y%m%d%H%M%S)
cd ~/otelcol
nohup ./otelcol-contrib --config=otel-collector-config.yaml 0</dev/null >otelcol_$timestamp.out 2>otelcol_$timestamp.err &
sleep 3
echo "Started $(pidof otelcol-contrib)"
Create Stop Script
vi ~/stop_otelcol.sh

#! /bin/bash

pid=$(pidof otelcol-contrib)
if [ -n "$pid" ]; then
    kill $pid
    echo "Stopped $pid"
else
    echo "No pid found"
fi
Start/Stop
cd ~
./start_otelcol.sh
./stop_otelcol.sh
Checks
Log Files:
~/otelcol/otelcol_<YYYYMMDDHHMMSS>.err
~/otelcol/otelcol_<YYYYMMDDHHMMSS>.out
3. Install Grafana
Download Grafana to your home directory and unpack it
cd ~
curl -O https://dl.grafana.com/enterprise/release/grafana-enterprise-10.1.4.linux-amd64.tar.gz

chmod -R 755 grafana-enterprise-10.1.4.linux-amd64.tar.gz
tar -xvzf grafana-enterprise-10.1.4.linux-amd64.tar.gz --directory ~
Create Softlink
ln -sf grafana-10.1.4 ~/grafana
Create Start Script
vi ~/start_grafana.sh

#! /bin/bash

timestamp=$(date +%Y%m%d%H%M%S)
cd ~/grafana
nohup bin/grafana server 0</dev/null >grafana_$timestamp.out 2>grafana_$timestamp.err &
sleep 3
echo "Started $(pidof grafana)"
Create Stop Script
vi ~/stop_grafana.sh

#! /bin/bash

pid=$(pidof grafana)
if [ -n "$pid" ]; then
    kill $pid
    echo "Stopped $pid"
else
    echo "No pid found"
fi
Start/Stop Grafana
cd ~
./stop_grafana.sh
./start_garfana.sh
Checks
Log Files:
~/ grafana/grafana_<YYYYMMDDHHMMSS>.err
~/ grafana/grafana_<YYYYMMDDHHMMSS>.out
URL:
http://192.168.88.17:3000/
user:admin
pass:admin
4. Configure Universal Agents to send metrics to open-telemetry
Configure uags.conf and omss.conf of the Universal Agent
# Add the following to uags.conf
# Adjust the sample IP "192.168.88.17" Address to your IP or hostname

vi/etc/universal/uags.conf

otel_export_metrics YES
otel_service_name agt_wiesloch_uag
otel_metrics_endpoint http://192.168.88.17:4318

# Add the following to omss.conf

vi/etc/universal/omss.conf

otel_export_metrics YES
otel_service_name agt_wiesloch_oms
otel_metrics_endpoint http://192.168.88.17:4318

# Note: Agents push metrics via http ( not grpc ) port 4318
5. Update Universal Controller (uc.properties) to send metrics to open-telemetry
Update uc.properties file
# enable metrics for UC Controller in uc.properties file
# Adjust the vi command to point to your uc.properties file

vi /home/stonebranch/apache-tomcat-9.0.39/conf/uc.properties

# Metrics uses http protocol:
uc.otel.exporter.otlp.metrics.endpoint http://localhost:4317
6. Configure a sample Dashboard in Grafana (add prometheus datasource, create visualization)
In the following example, a Grafana Dashboard with one visualization showing the OMS Server Status will be configured.
The following Steps need to be performed:
- Log-in to Grafana
- Add prometheus as data source for Grafana
- Create a new Dashboard and add a new visualization to it
- Configure visualization
- Display Dashboard
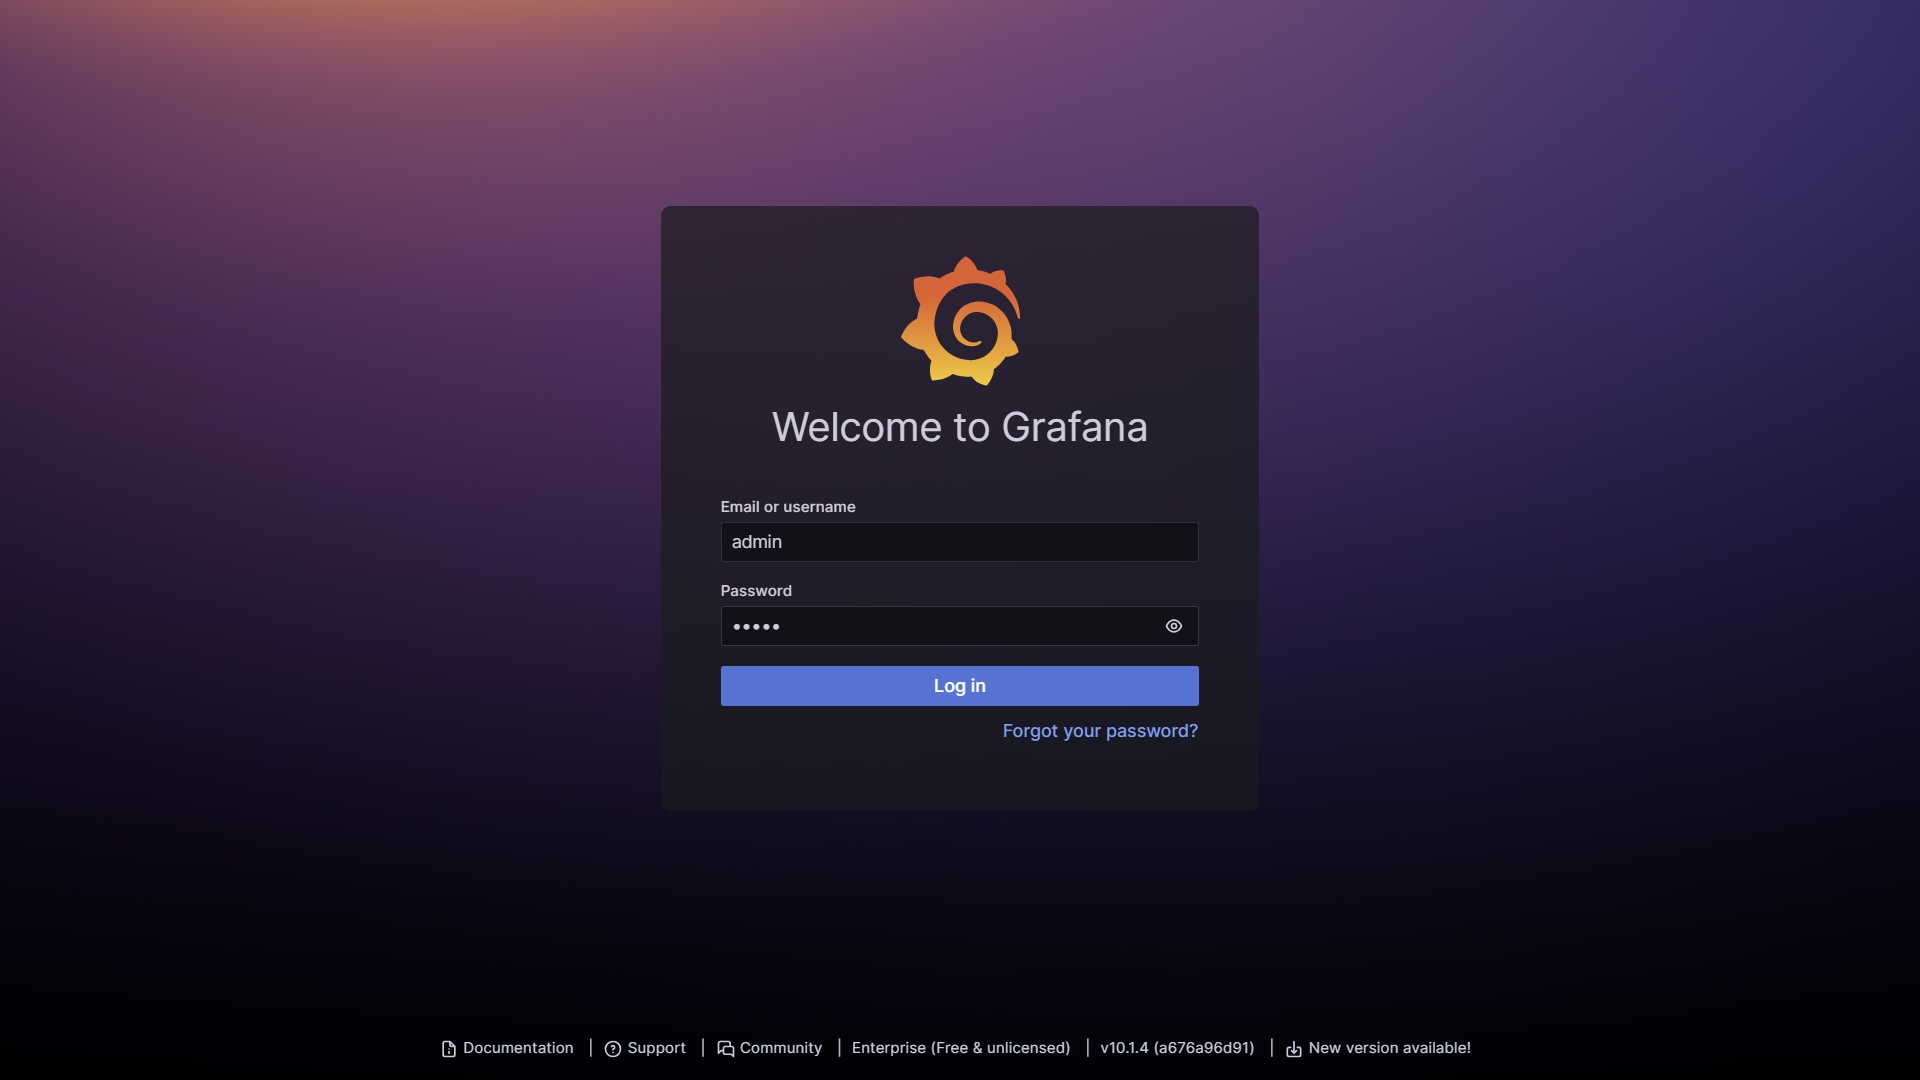
Log-in to Grafana
URL: http://192.168.88.17:3000/ user:admin pass:admin
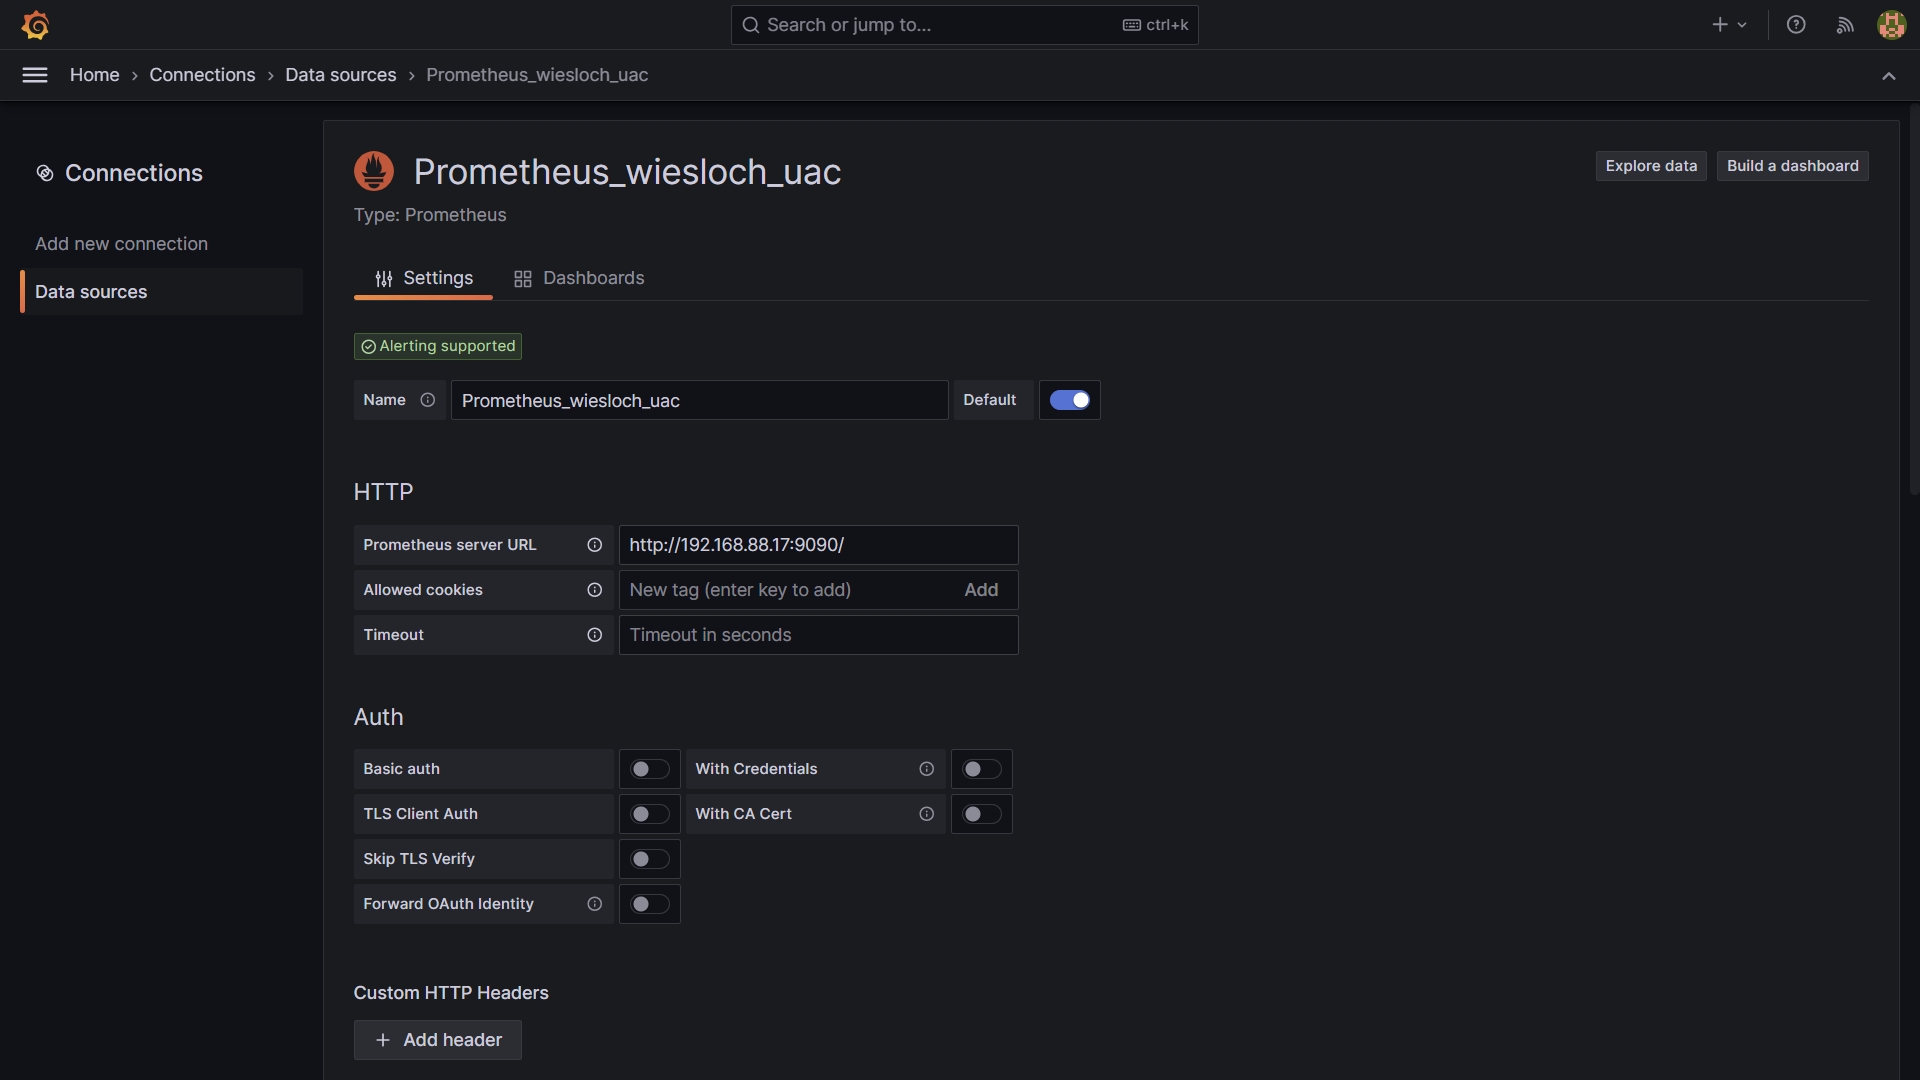
Add prometheus as data source for Grafana
Datasource: Prometheus - http://192.168.88.17:9090/ ( adjust the sample IP to your Server IP Address or Hostname )
Test the connection:
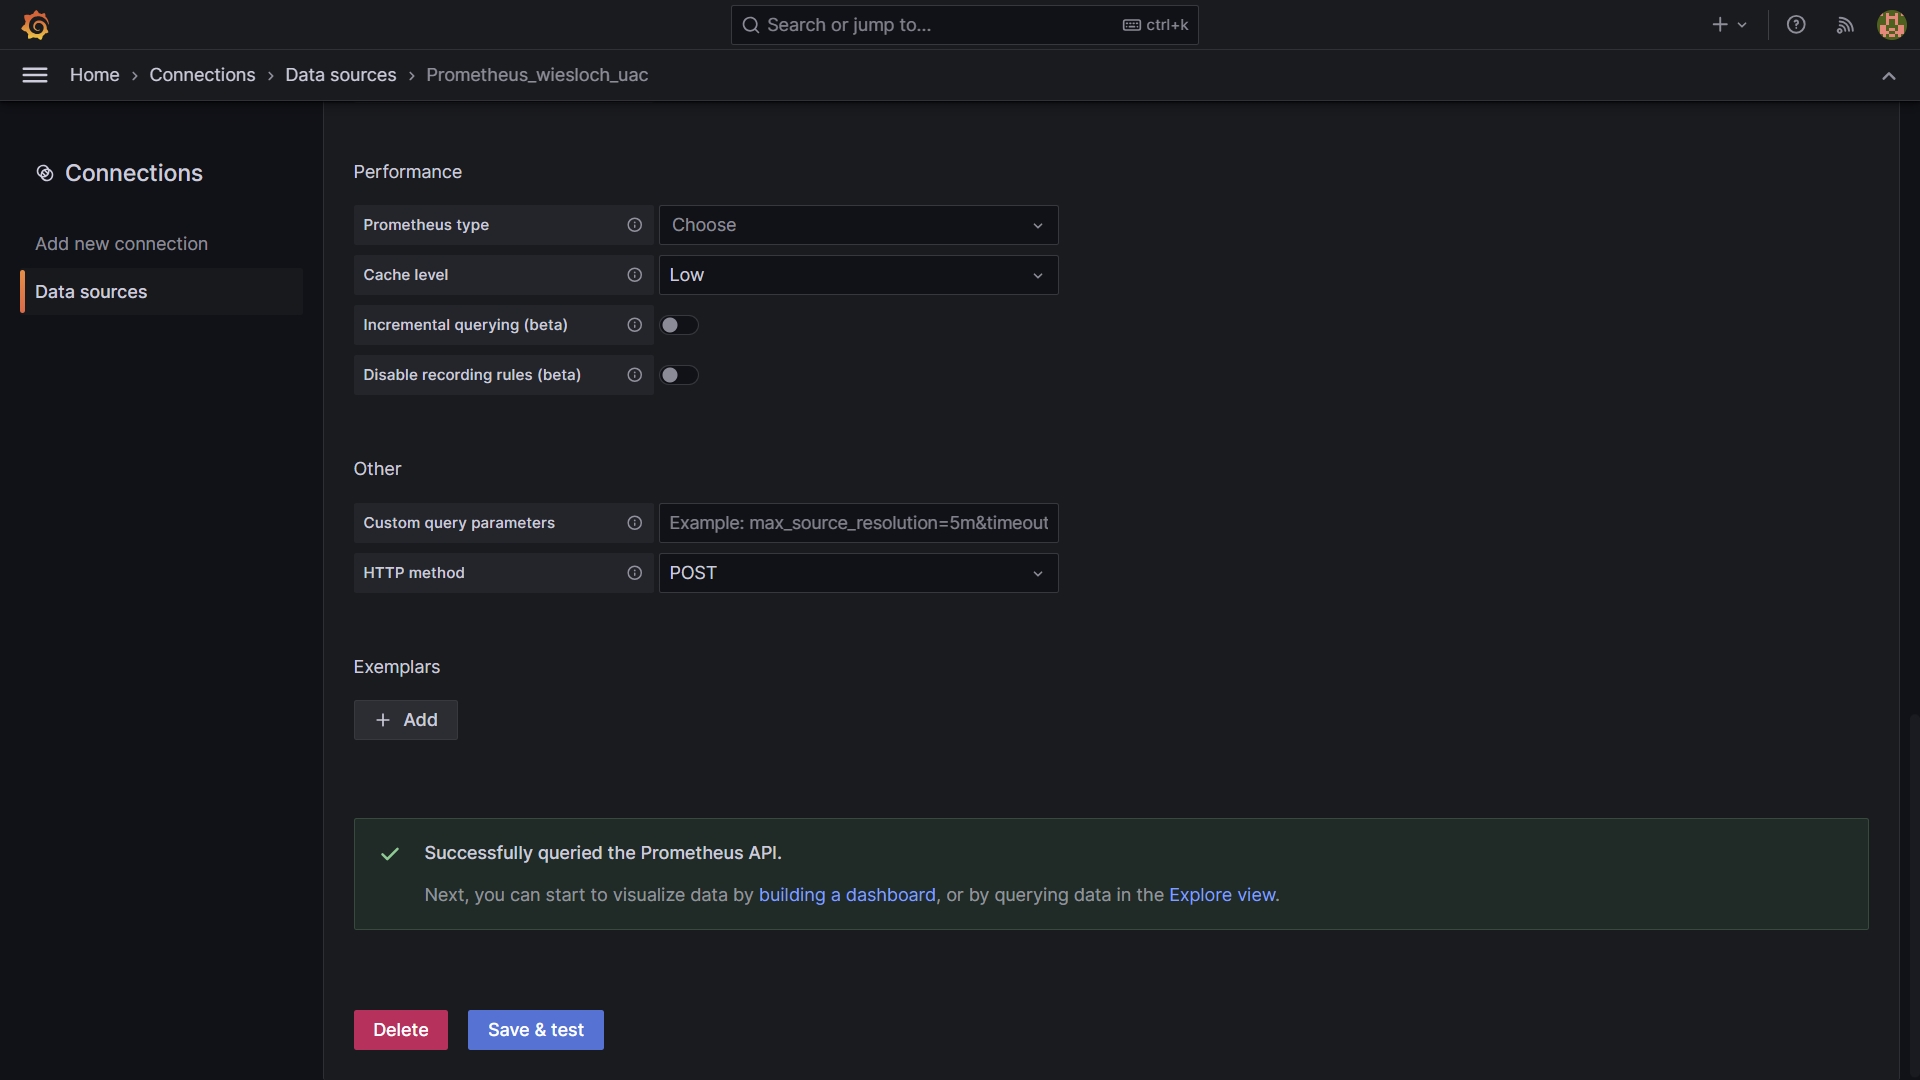
Create a new Dashboard and add a new visualization to it
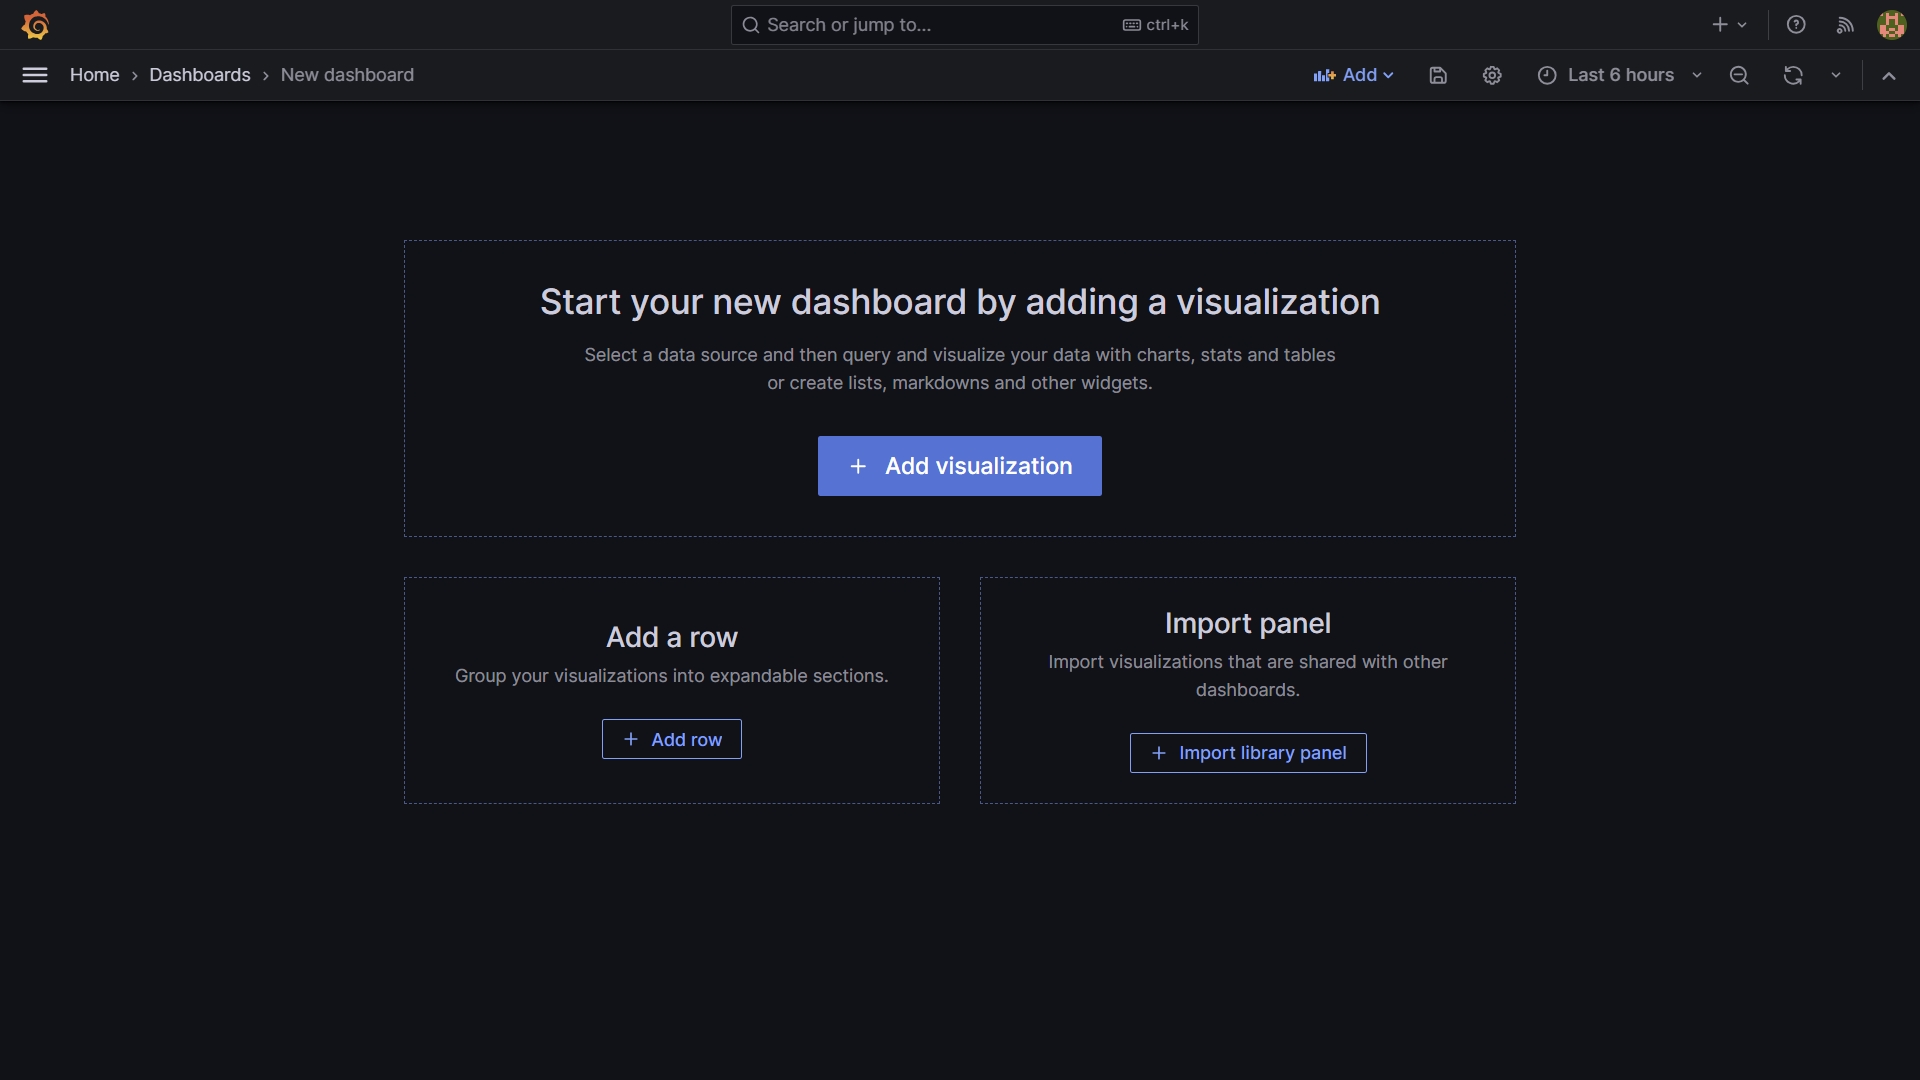
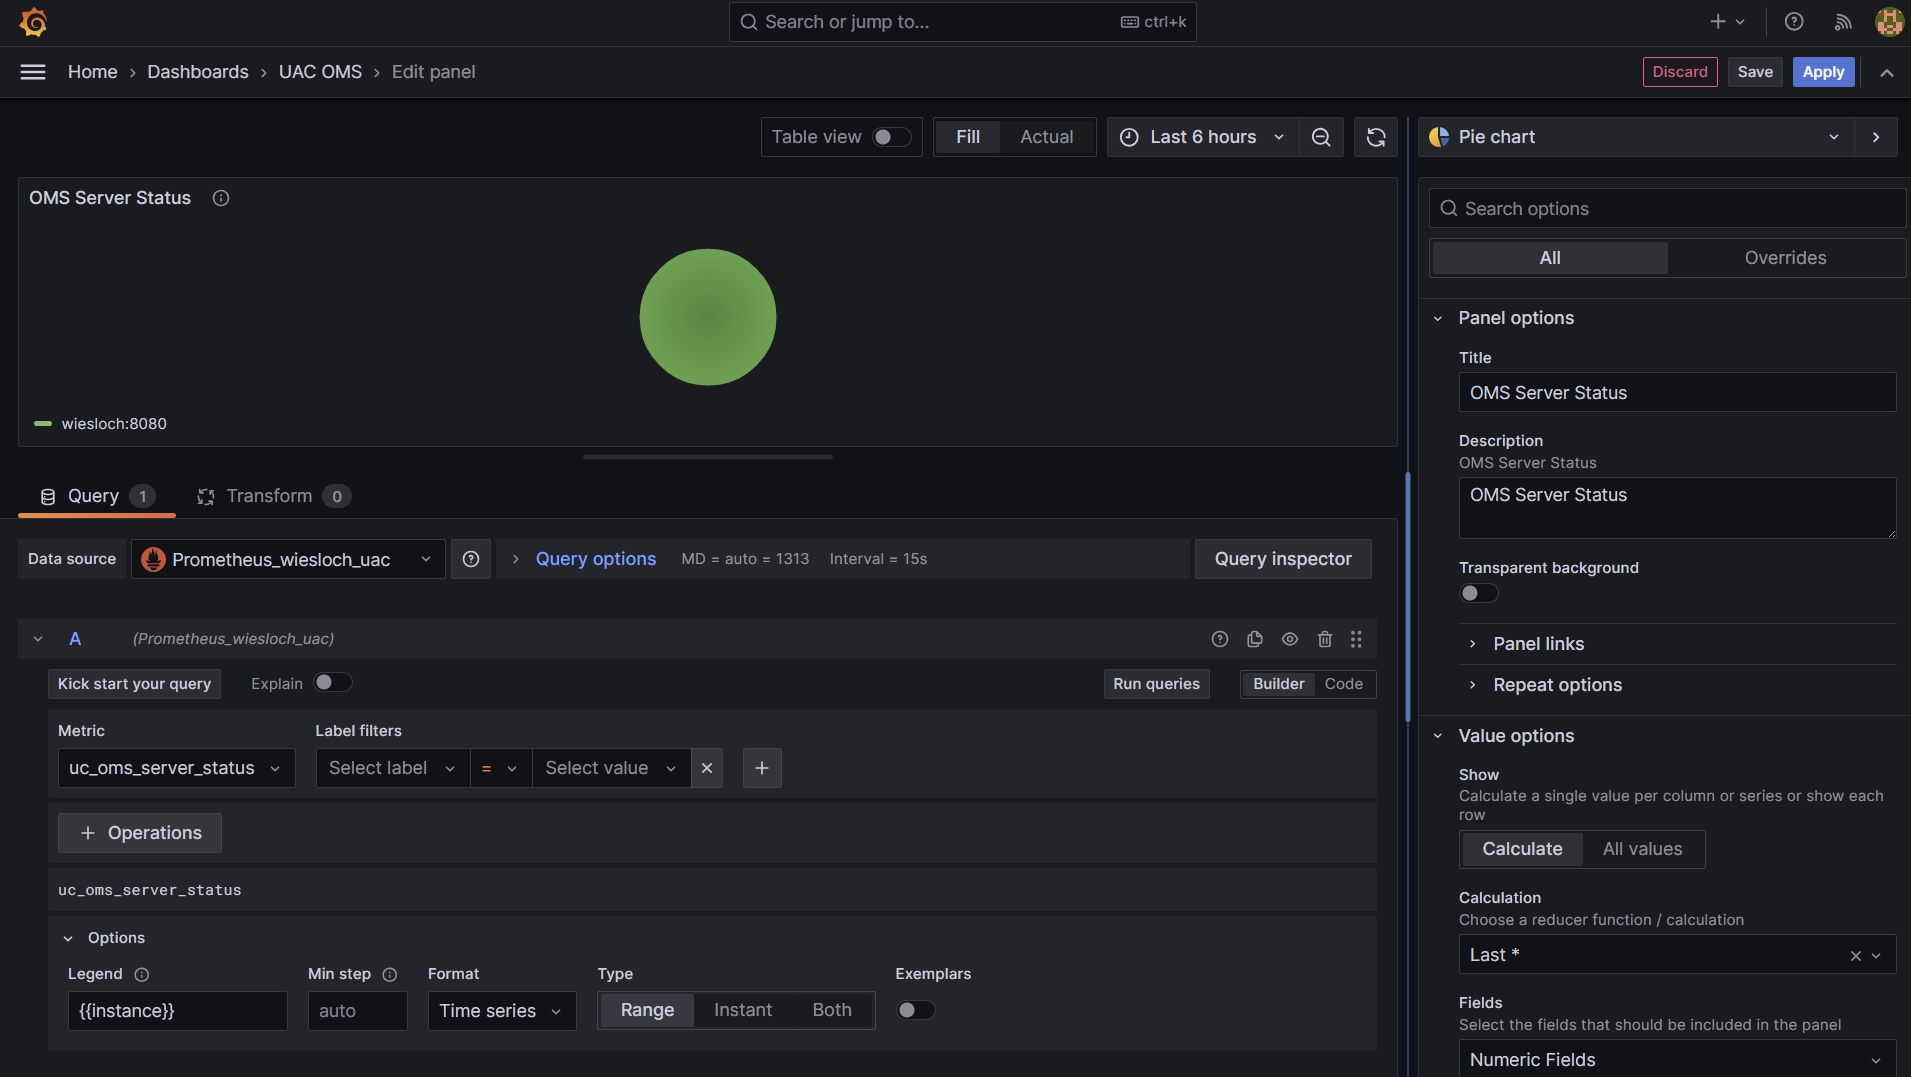
Configure Visualization
- Select Prometheus as Data Source
- Select the Metric uc_oms_server_status
- Enter a Title and Description e.g. OMS Server Status
- In the Legend Options enter {{instance}}
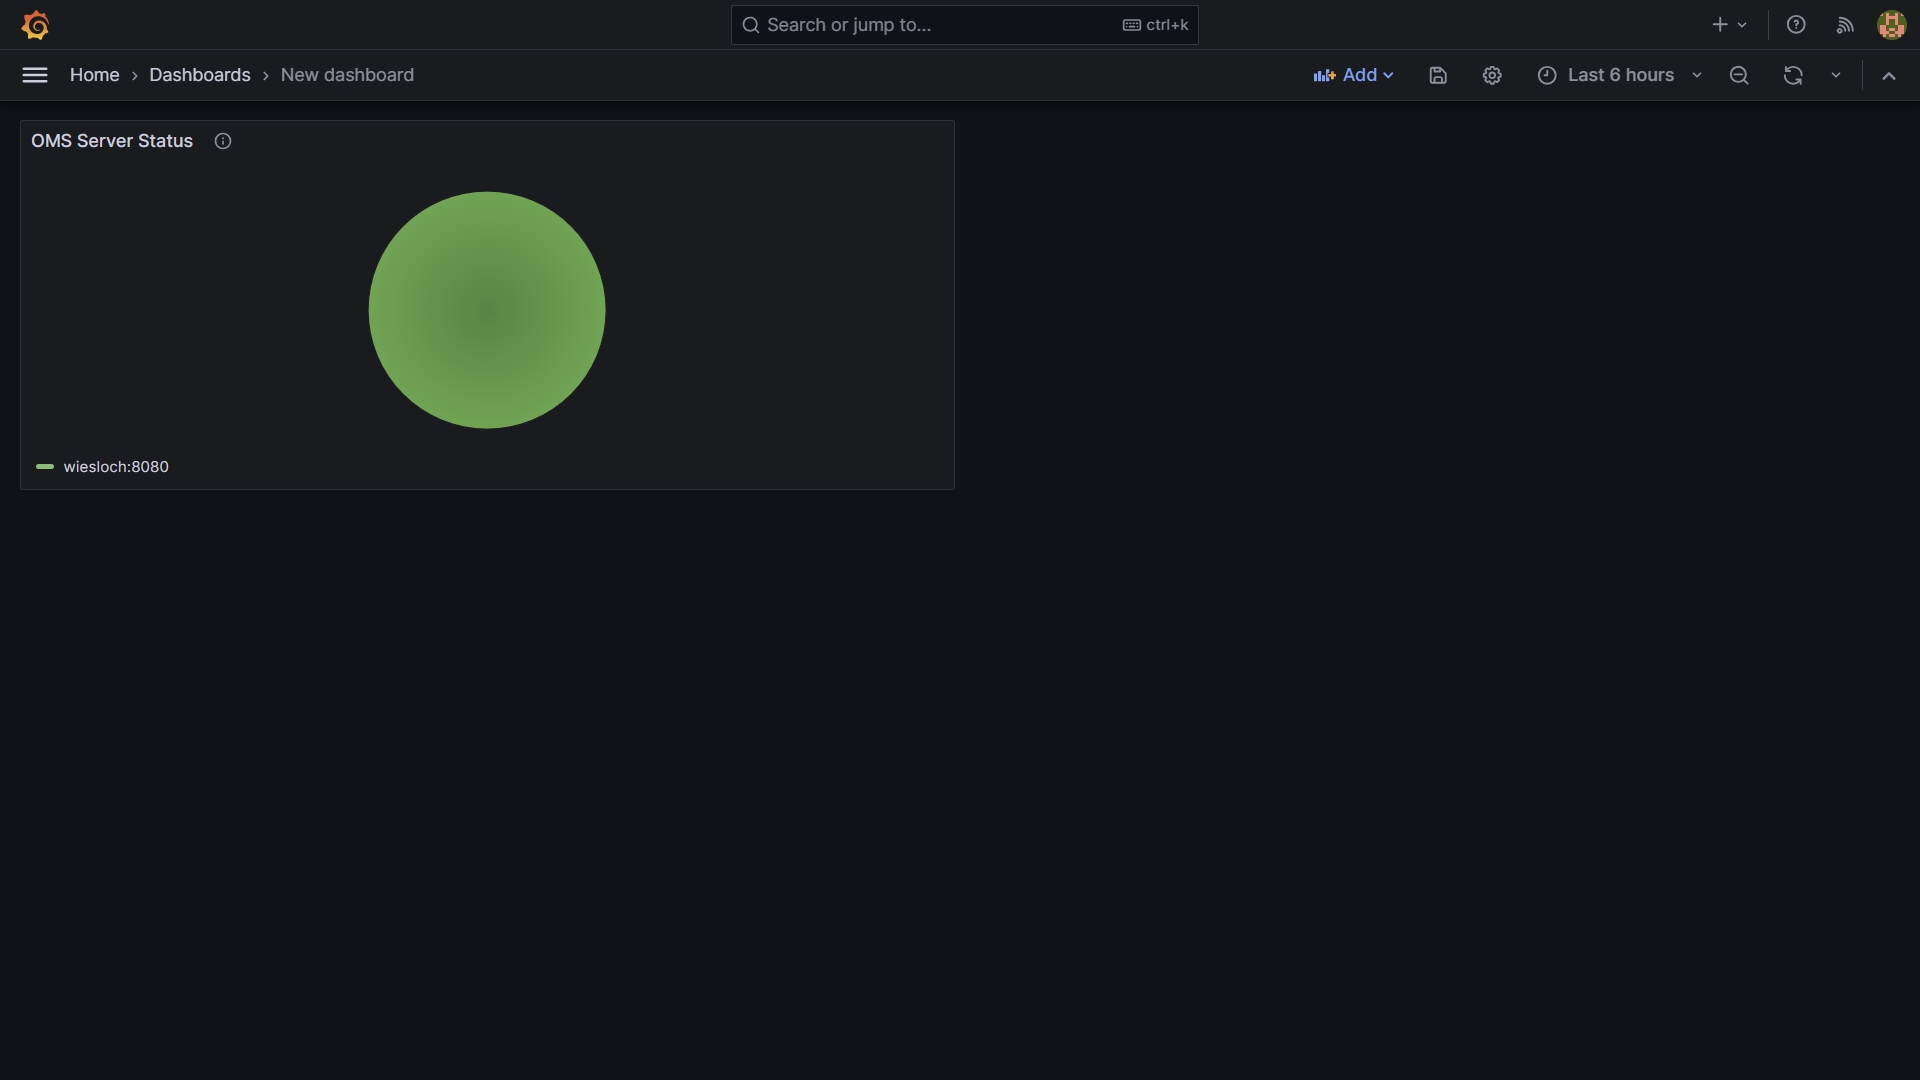
Display Dashboard
7. Optionally configure grafana for TLS
TLS for Grafana
documentation link:
https://grafana.com/docs/grafana/latest/setup-grafana/set-up-https/

cd ~/grafana
# generate private key
sudo openssl genrsa -out ~/grafana/grafana.key 2048

# generate certificate using the private key
sudo openssl req -new -key ~/grafana/grafana.key -out ~/grafana/grafana.csr

# check
ls -ltr ~/grafana
-rw-------  1 root        root   1679 Nov 10 09:24 grafana.key
-rw-r--r--  1 root        root   1070 Nov 10 09:28 grafana.csr

# create self-sign the certificate with the private key, for a period of validity of 720 days:
sudo openssl x509 -req -days 720 -in ~/grafana/grafana.csr -signkey ~/grafana/grafana.key -out ~/grafana/grafana.crt

# set the appropriate permissions for the files
sudo chown stonebranch ~/grafana/grafana.crt
sudo chown stonebranch ~/grafana/grafana.key
sudo chmod 400 ~/grafana/grafana.key ~/grafana/grafana.crt

# adjust grafana ini file defaults.ini
vi ~/grafana/conf/defaults.ini

[server]
protocol = https
http_port = 3000
domain = wiesloch
cert_file = /home/stonebranch/grafana/grafana.crt
cert_key = /home/stonebranch/grafana/grafana.key

# re-start grafana.
~/start_grafana.sh

# Check URL accessible via HTTPS
URL:
https://192.168.88.17:3000/
Login: admin/admin