Monitoring Activity from the Activity Monitor
- Stonebranch (Deactivated)
Overview
The Activity Monitor is the Universal Controller central console of activity, a real-time display of task instance status. It displays a list of task instances contained in the Universal Controller All Task Instances table (ops_exec), as controlled by your selections in the Activity Monitor Selections task bar at the top of the list.
A task bar below the list allows you to control displays settings for the selected task instances.
A task instance is the "run" version of a task. Each time a task runs, the Controller creates a task instance and monitors its activity on the Activity Monitor. Each task instance is a separate record.
The Activity Monitor allows you to issue commands against task instances. You can also issue commands from the Task Instances list (and the Task Instances list for a specific task). In cases where the task Details did not instruct the Controller to retrieve output automatically, you can retrieve output manually from any completed task.
Accessing the Activity Monitor
From the Automation Center navigation pane, select Task Instances > Activity. The Activity Monitor displays task status information based on the settings in the Activity Monitor Selections Task Bar.
When you first log in to the Controller, the Activity Monitor does not automatically monitor Controller activity, since the Activity Monitor Automatically user preference value, by default, is set to No. You can change this value at any time.
The following is a sample Activity Monitor that is not monitoring activity.
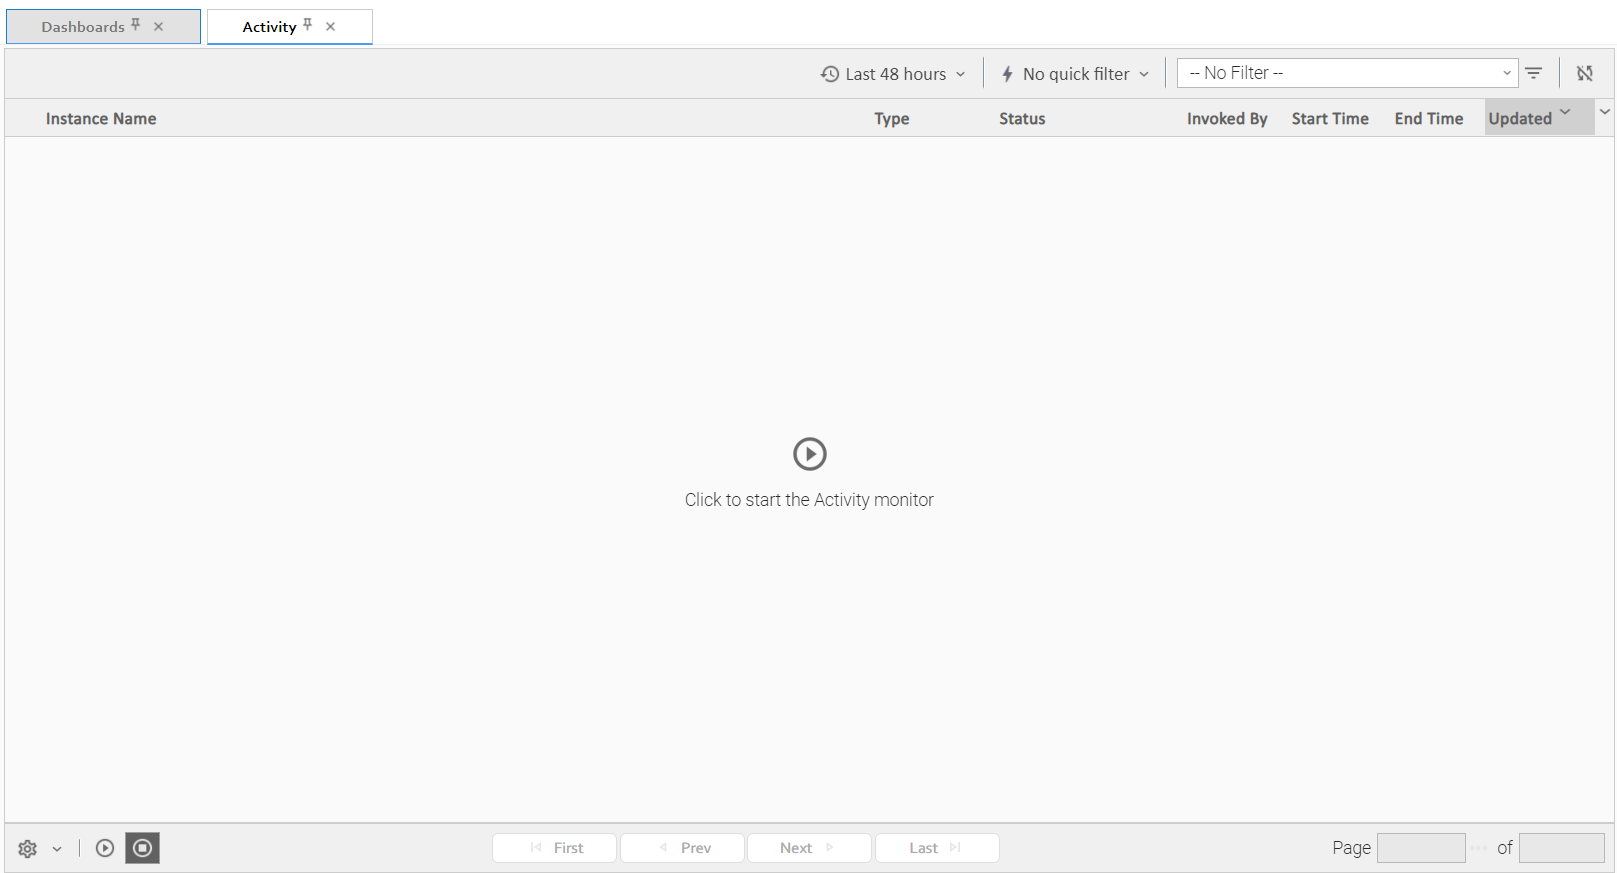
You can manually start the Activity Monitor at any time by clicking the Start button in the center of the screen. You also can manually start or stop the Activity Monitor at any time from the Activity Monitor Display task bar. However, on your next login to the Controller, the Activity Monitor Automatically value will determine whether or not the Activity Monitor automatically starts monitoring the Controller.
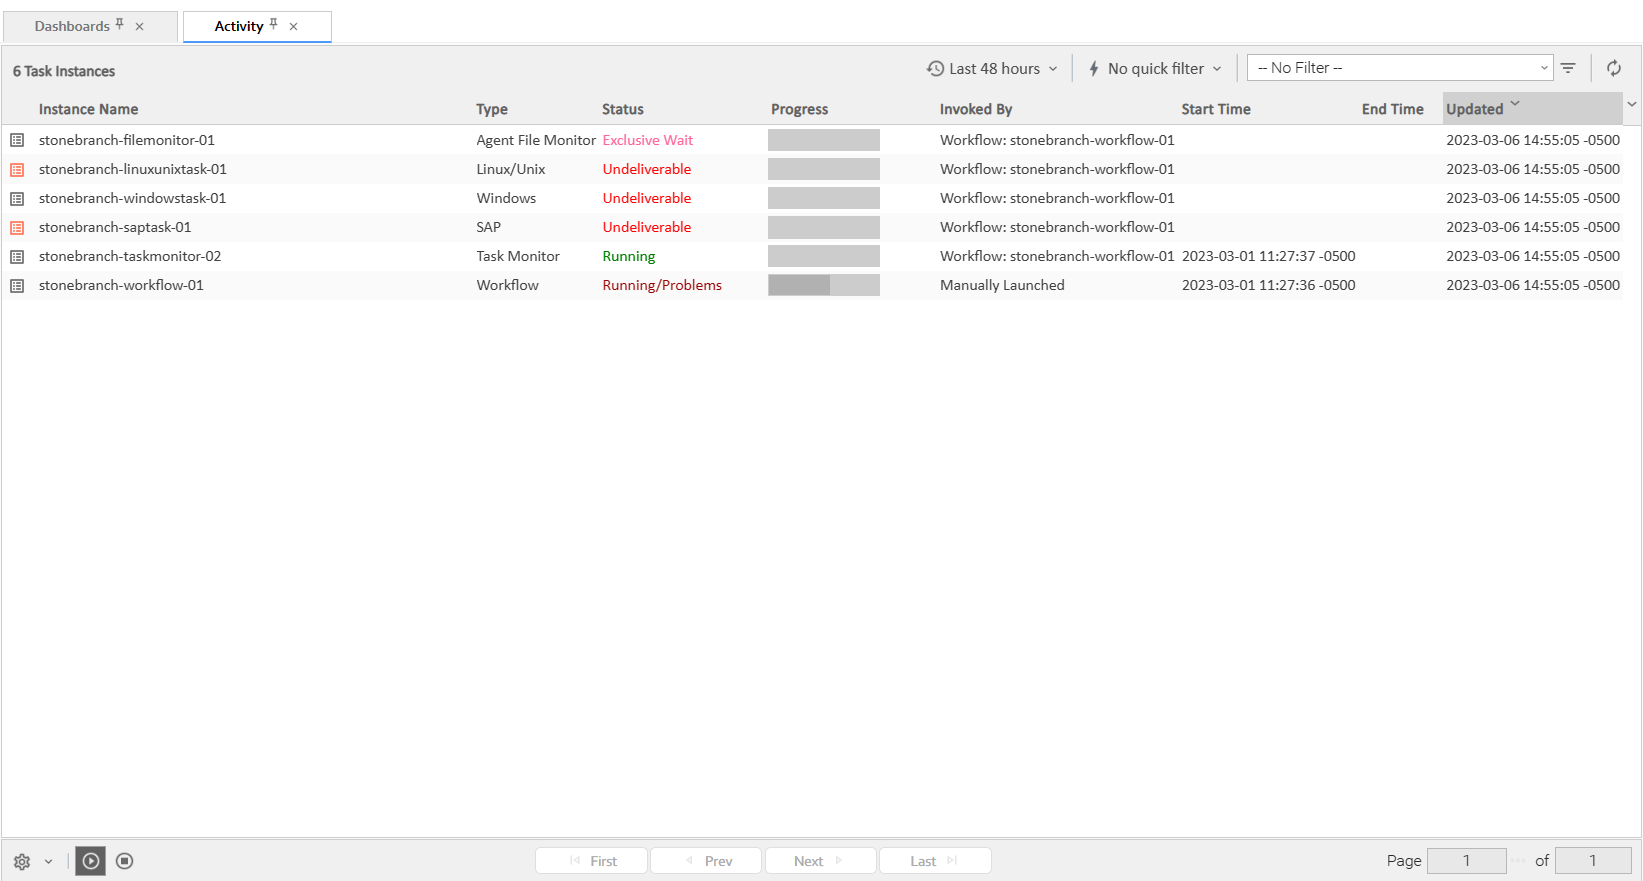
The following is a sample Activity Monitor that is monitoring activity.
Note
Once you have displayed the Activity Monitor, it remains open throughout your Controller session unless you manually close it by clicking the x icon in the Activity Monitor tab at the top of the page. (The same is true for the Dashboard Details.)
If you click a page in the Services while viewing the Activity Monitor or Dashboards, a new tab for that page will open. The Activity Monitor and Dashboards tabs remain at the top of the screen if you navigate from them, providing for a quick return to those pages.
Activity Monitor Column Descriptions
The following table describes the default columns of information displayed on the Activity Monitor.
|
Column Name |
Description |
|---|---|
|
Instance Name |
Name of this task instance. |
|
Type |
Type of task instance. |
|
Status |
Current status of this task instance. |
|
Invoked By |
How the task instance was launched. One of the following:
|
|
Start Time |
Date and time the task instance started. |
|
End Time |
Date and time the task instance ended. |
|
Updated |
Date and time that this task instance was last updated. |
Activity Monitor Task Bar
An Activity Monitor task bar displays across the top of the Activity Monitor, which allows you to select which task instances display on the Activity Monitor.

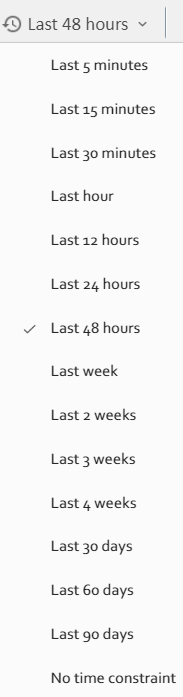
Time Constraint
The Time Constraint drop-down list in the Activity Monitor Selections task bar allows you to select a time frame for which you want task instances to display on the Activity Monitor.
The default time constraint, as specified by the Activity Time Constraint user preference, is 48 hours.
Quick Filter
The Quick Filter menu in the Activity Monitor Selections task bar allows you to filter the list with simple, pre-defined criteria so that only task instances matching that criteria within the selected Time Constraint and any selected Filter display on the Activity Monitor.
To display the Quick Filter menu, click the Quick Filter button on the task bar which, by default, is identified as No quick filter.
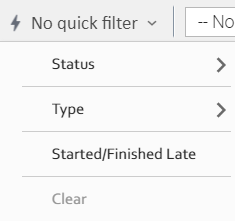
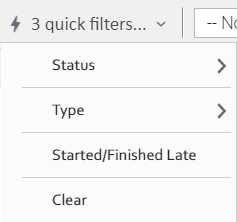
The Quick Filter menu allows you to select any combination of the following filters to the list:
- Status: Individual task instance status and the following composite statuses:
- Active = All task instance statuses except Skipped (180), Finished (190), Success (200).
- Blocked = Waiting (10), Held (20), Exclusive Wait (23), Resource Wait (30), Execution Wait (33), and Action Required (60) task instance statuses.
- Completed = Skipped (180), Finished (190), and Success (200) task instance statuses.
- Problem = Undeliverable (35), Running/Problems (81), Cancel Pending (99), In Doubt (110), Start Failure (120), Confirmation Required (125), Cancelled (130), and Failed (140) task instance statuses.
- Type: Individual task type.
- Started/Finished Late: Task instance started and/or finish late according to the Start / Finish Late times specified in the task Details.
- Clear = Clears all Quick Filters from the list. (You can clear individual Quick Filters by deselecting them on the menu.)
Note
You can change the names of the composite statuses Quick Filters (Active, Blocked, Completed, and Problem), and the task instance statuses included in each one, by editing the System Default Activity Quick Filters Universal Controller system property.
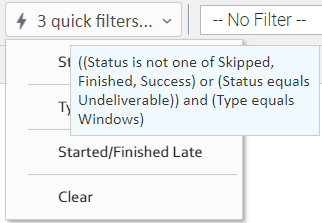
You must select each Quick Filter individually; you cannot use Ctrl-click to select multiple Quick Filters. The Quick Filter button provides a count of how many Quick Filters have been applied to the list. For example, the following Quick Filter button shows that three separate quick filters have been applied.
The Clear button now is enabled, allowing you to remove all Quick Filters from the list in one click.
To see which Quick Filters have been applied to the list, hover your cursor over the Quick Filter button.
Filter
The Filter field and Filter icon in the Activity Monitor Selections task bar allows you to filter the list with complex, user-defined criteria so that only task instances matching that specified criteria within the selected
Time Constraint and any selected
Quick Filter display on the Activity Monitor.
![]()
See Filters for detailed information an applying and saving filters.
Refresh
The Refresh button enables you to perform a manual refresh of the information displayed on the Activity Monitor.
![]()
When you click the Refresh button, the button is disabled (the icon turns grey) until the refresh is complete. The Refresh button also is disabled if the Activity Monitor has not been started and is not monitoring activity.
Activity Monitor Display Task Bar
An Activity Monitor Display task bar displays across the bottom of the Activity Monitor, which allows you to select which task instances on the Activity Monitor to view and how often the data for those task instances is refreshed.
![]()
Settings
The Settings drop-down list provides the following selections:
- Results Per Page
- Refresh Rate
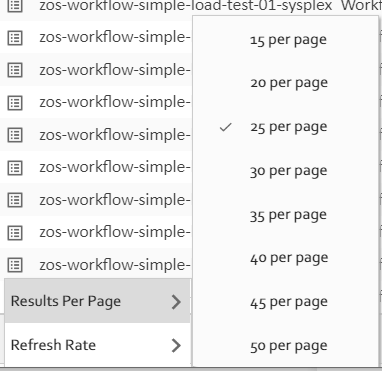
Results Per Page
Hover your cursor Results Per Page on the Settings drop-down list to select the number of task instances to be displayed on a page (default is 25).
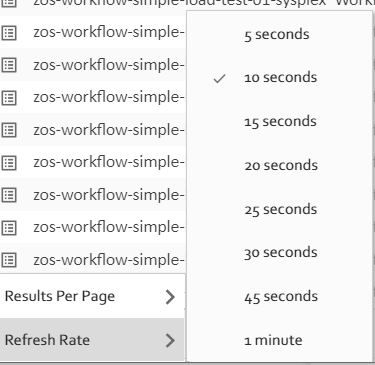
Refresh Rate
Hover tour cursor over Refresh Rate on the Settings drop-down list to select a refresh rate for the data displayed on the Activity Monitor (default is 10 seconds).
Start and Stop Activity Monitor
Start and Stop buttons on the Activity Monitor allow you to start and stop the monitoring of activity on the Controller.
The Activity Monitor Automatically value specifies whether or not the Activity Monitor automatically is monitoring Controller activity.
You can override that value by electing either of the following, as appropriate:
|
|
Starts monitoring Controller activity. The Activity Monitor displays task instances according to the current Time Constraint setting and any applied Filters. |
|
|
Stops monitoring Controller activity. All task instances are removed from the Activity Monitor display. |
Page Navigation Buttons
Page navigation buttons allow you to scroll through the pages of task instances that are displayed according to the current Activity Monitor settings.
|
|
Displays the first page of the list. |
|
|
Displays the previous page of the list. |
|
|
Displays the next page of the list. |
|
|
Displays the last page of the list. |
Note
You also can specify a specific page number to go to (see Page Numbering, below).
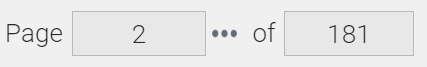
Page Numbers
Page Numbers buttons in the task bar identify the number of the currently displayed page and the total number of pages.
You can go to a specific page number by clicking the ellipse ( ... ) icon that displays after the current page number. A Go To Page pop-up displays.
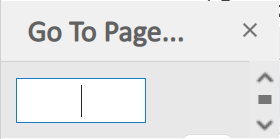
Enter a page number and click the Go button to navigate to that page.
Displaying Task Instance Details
To display Details for a specific task instance displayed on the Activity Monitor, click the Details icon next to the Instance Name of that task instance.
From the task Instance Details, you can also display additional Details about the task instance:
|
Displays Metadata for the task instance, including a status history. |
|
|
Displays complete database details for the task instance. |
|
|
Displays a list of all variables available to the task instance, including any variables inherited from the parent or embedded (sub-Workflow) Workflow of the task instance. |
Issuing Commands Against Task Instances
Where applicable, you can manually intervene in processing by issuing a command against one or more task instances.
For information about the commands available for each type of task, see Supported Commands.